Figure 4.
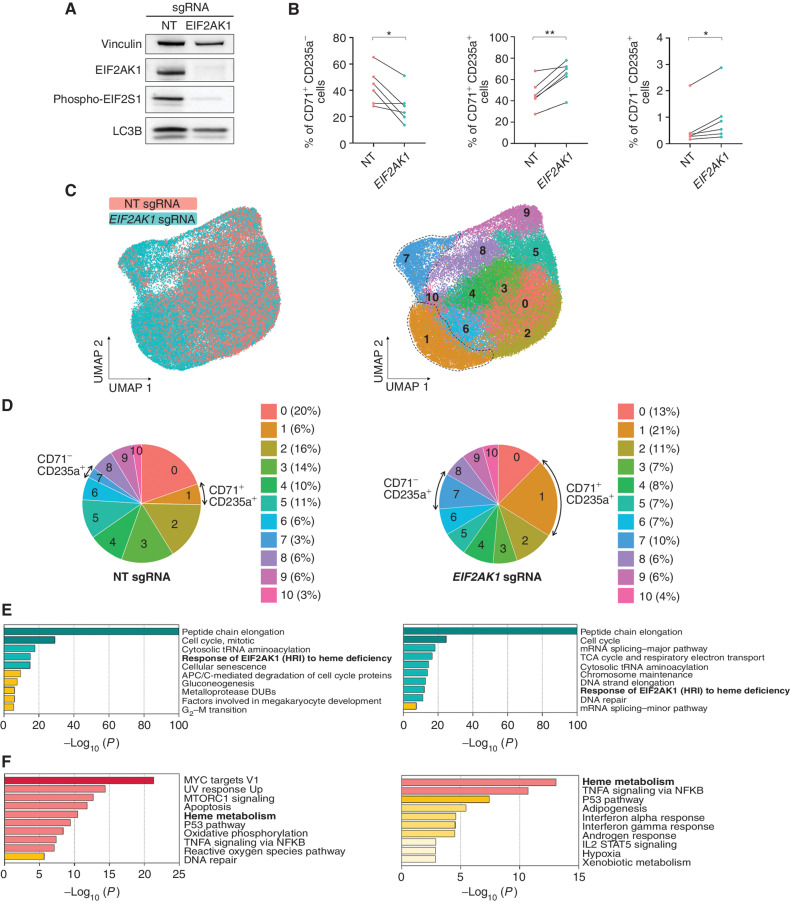
Inhibition of EIF2AK1 overcomes the accumulation of RS and enables red blood cell production. A, Representative western blot analysis of EIF2AK1, phospho-EIF2S1, and LC3B in nontargeting (NT) sgRNA– and EIF2AK1 sgRNA–treated SF3B1-mutant MDS-RS cells at day 13 of culture. Vinculin was used as a loading control. B, Frequencies of CD71+CD235a− (left), CD71+CD235a+ (middle), and CD71−CD235a+ (right) erythroblasts in NT sgRNA– or EIF2AK1 sgRNA–treated MDS-RS samples (n = 6) at day 13 of culture. Each symbol represents one sample; lines connect paired samples. Statistical significance was calculated using paired t tests. C, UMAP plots of scRNA-seq data for single cells from NT sgRNA–treated (n = 30,307) or EIF2AK1 sgRNA–treated (n = 36,825) cells from 3 pooled SF3B1-mutant MDS-RS samples at day 13 of erythroid culture. Each dot represents one cell. Different colors represent the sample origin (left) and cluster identity (right). Dotted lines indicate terminally differentiated erythroblasts. D, Distribution of cells from NT (left) and EIF2AK1 (right) sgRNA–treated SF3B1-mutant MDS-RS samples among the clusters shown in C. Arrows indicate clusters 1 and 7.E, Pathway enrichment analyses of the significantly downregulated genes in EIF2AK1 sgRNA–treated SF3B1-mutant MDS-RS cells from clusters 1 (left) and 7 (right; adjusted P ≤ 0.05). The top 10 Reactome or Hallmark gene sets are shown. F, Pathway enrichment analyses of the significantly upregulated genes in EIF2AK1 sgRNA–treated SF3B1-mutant MDS-RS cells from clusters 1 (left) and 7 (right; adjusted P ≤ 0.05). The top 10 Hallmark gene sets are shown.

