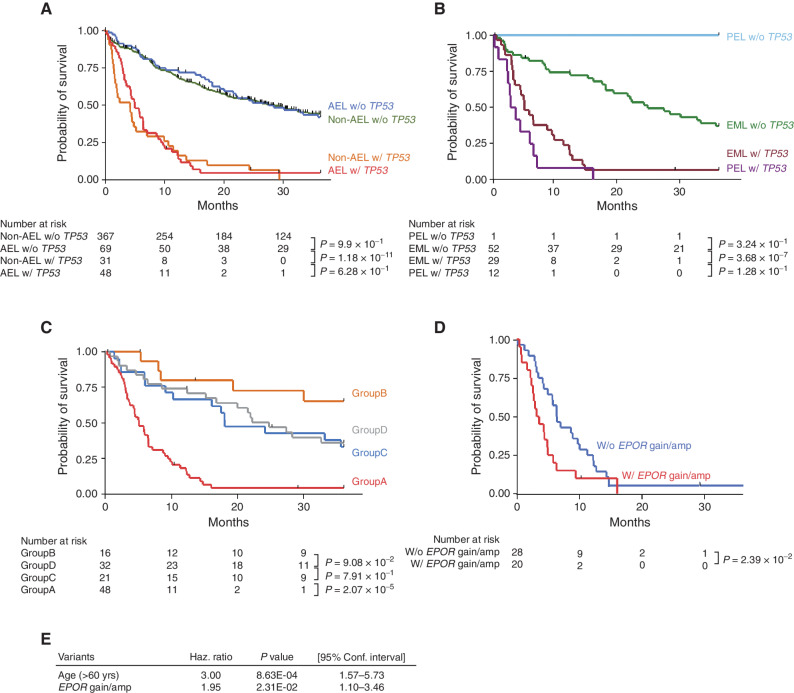
Figure 5.
Prognostic impacts of genetic lesions. A and B, OS distributions in AEL and non-AEL (A) and PEL and EML (B) divided by TP53 mutation status. C, Kaplan–Meier survival curves are shown according to genetically clustered groups in the AEL cohort (A−D; Fig. 2). D, Kaplan–Meier survival curves are shown according to the presence or absence of EPOR gains/focal amplifications in TP53-mutated AEL. E, The result of multivariate analysis.

