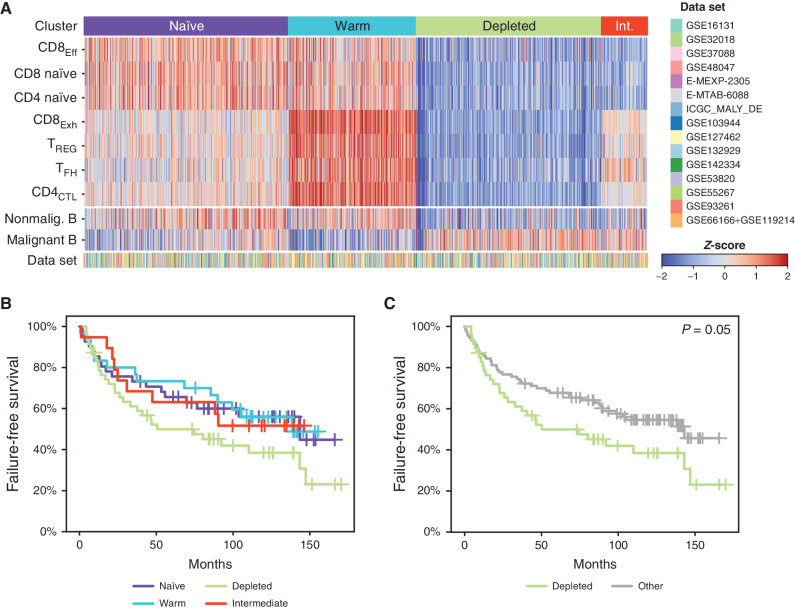
Figure 4.
Deconvolution of T-cell signatures in a large independent series of FL tumors. A, A heat map shows the relative proportions of CD8 and CD4 LME T-cell populations inferred by deconvolution of publicly available bulk gene-expression microarray or RNA-sequencing data sets (n = 1,269 FL tumors from 15 data sets). Unsupervised clustering identified 4 characteristic patterns (naïve, warm, depleted, intermediate (Int.)) with a different relative abundance of tumor-infiltrating T-cell populations. Relative B-cell proportion is shown for reference using the same method but was not used for clustering. B and C, Kaplan–Meier curves of FFS for 137 R-CHOP-treated FL patients are shown according to all LME subtypes (B) or comparing the depleted subtype to others (C). P values were calculated using a log-rank test.

