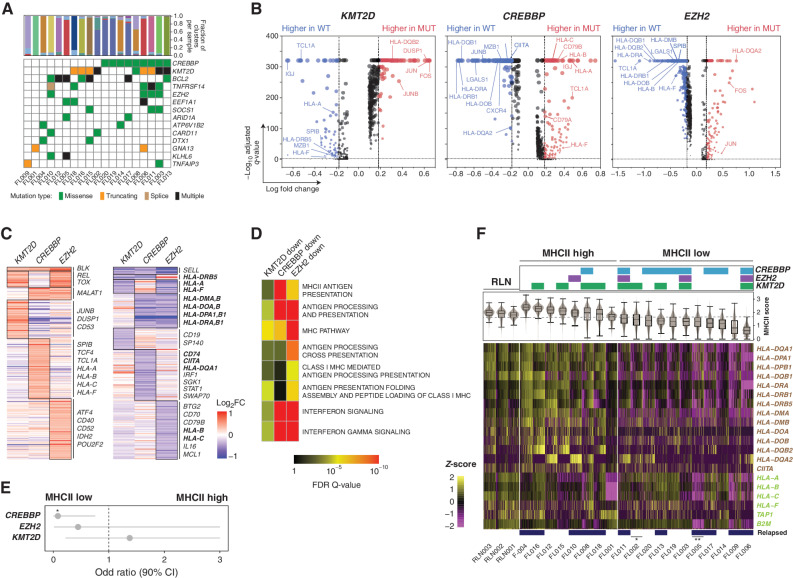
Figure 5.
Effect of somatic mutations on tumor B-cell expression profiles. A, An oncoplot shows recurrently mutated genes in the 19 FL tumors with available DNAs. B, Volcano plots displaying differentially expressed genes (DEG) between tumor B cells from KMT2D (left), CREBBP (middle), or EZH2 (right) wild-type and mutant tumors. Examples are annotated and the full list is provided in Supplementary Table S6. C, Heat maps displaying DEGs with increased (left) or decreased (right) expression associated with each mutation, with genes encoding cell-surface proteins annotated. Genes highlighted in bold belong to the MHCI and MHCII pathways defined by the KEGG pathway database. D, Pathway enrichment analysis of downregulated DEGs associated with each mutation showing an association between MHCII and CREBBP mutation, MHCI and EZH2 mutation, and IFN signaling with both CREBBP and EZH2 mutations. A full list of pathways is in Supplementary Table S8. E, Odds ratio (± 95% CI) is shown for the association between individual mutations and MHCII status (two-tailed Fisher exact test P = 0.028). F, The expression of MHCII (brown, above) and MHCI genes (green, below) is shown for individual tumor B cells from each tumor with available mutation data. Mutations of CREBBP, EZH2, and KMT2D are annotated at the top. Sample IDs are labeled at the bottom and tumors with additional mutations in *CIITA and **B2M that may also affect MHCII and MHCI expression, respectively, annotated by asterisks.

