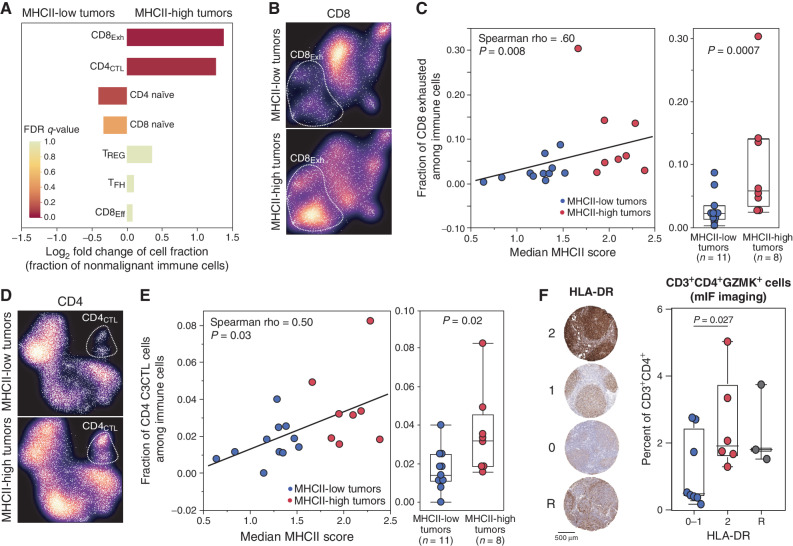
Figure 6.
Association between tumor MHCII status and tumor-infiltrating T-cell populations. A, A bar graph shows the fold change in cellular fractions of CD8 and CD4 T-cell populations between MHCII-low and MHCII-high tumors, colored by Fisher exact FDR q-value. The CD8Exh (fold change 3.43, Fisher exact q = 0.05) and CD4CTL (fold change 2.11; Fisher exact q = 0.07) populations are significantly higher in MHCII-high tumors compared with MHCII-low tumors. B, UMAP density plots show the relative representation of CD8Exh between MHCII-low (above) or MHCII-high (below) tumors. C, Scatter plot and bar plot show the quantitative and qualitative association between CD8Exh population and either the expression or status of MHCII on tumor B cells, respectively. D, UMAP density plots show the relative representation of CD4CTL, between MHCII-low (above) or MHCII-high (below) tumors. E, Scatter plot and bar plot show the quantitative and qualitative association between CD4CTL population and either the expression or status of MHCII on tumor B cells, respectively. F, IHC staining of HLA-DR was used to assign tumors into high (2), low (0–1), and reactive (R) groups, which were evaluated for the intrafollicular density of CD3+CD4+GZMK+ cytotoxic CD4 T cells. P values between MHCII-high and -low groups were calculated using a one-tailed t test.

