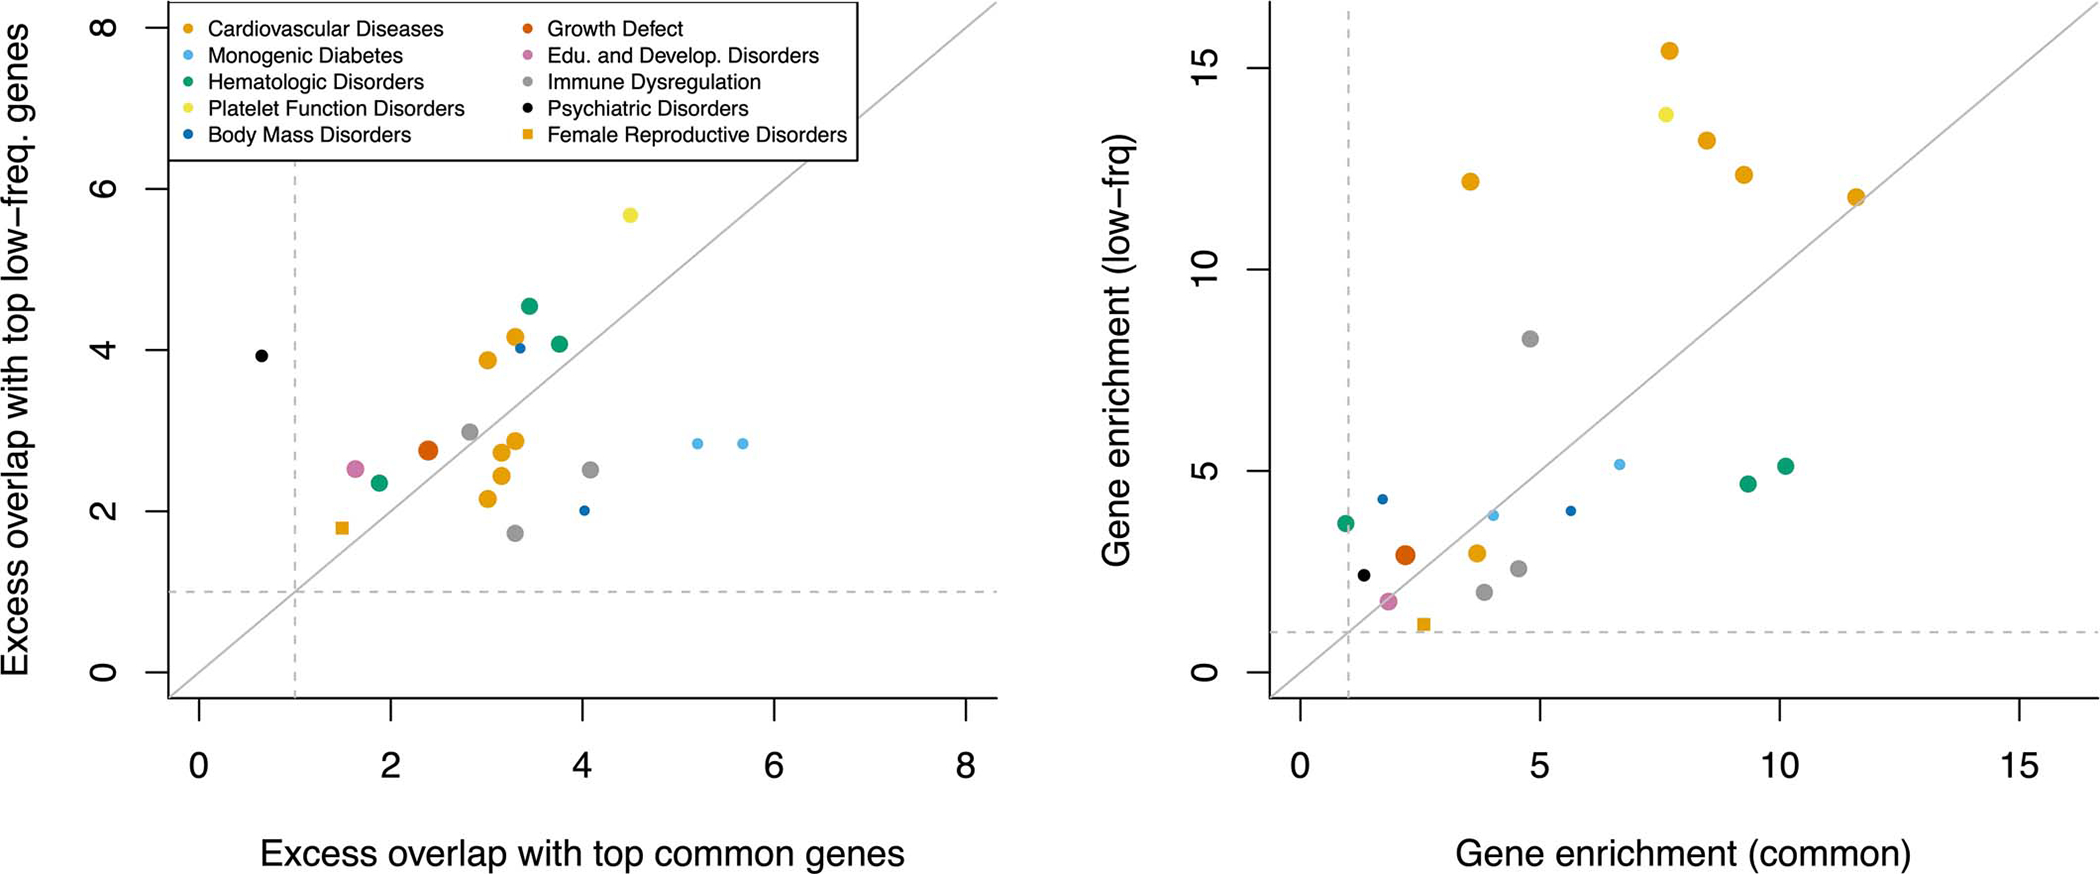
Extended Data Figure 5: Excess overlap between top genes contributing to common and low-frequency variant heritability linked to genes and disease-specific Mendelian disorder genes.

We report the excess overlap between phenotype-specific Mendelian disorder genes57 and the top 200 genes contributing to common and low-frequency variant heritability linked to genes (left), and the gene enrichment of disease-specific Mendelian disorder genes (i.e. [SNP-heritability linked to Mendelian disorder genes / SNP-heritability linked to all genes] / [number of Mendelian disorder genes / total number of genes]) across common and low-frequency variants (right). Each dot represents a disease/trait - Mendelian disorder gene set pair, and is colored by the Mendelian disorder gene set. These two results suggest that both the set of top 200 genes and the per-gene heritability estimates are unlikely to be driven by noisy estimates arising from finite sample size. We restricted analyses to 21 traits analyzed in ref. 57.
