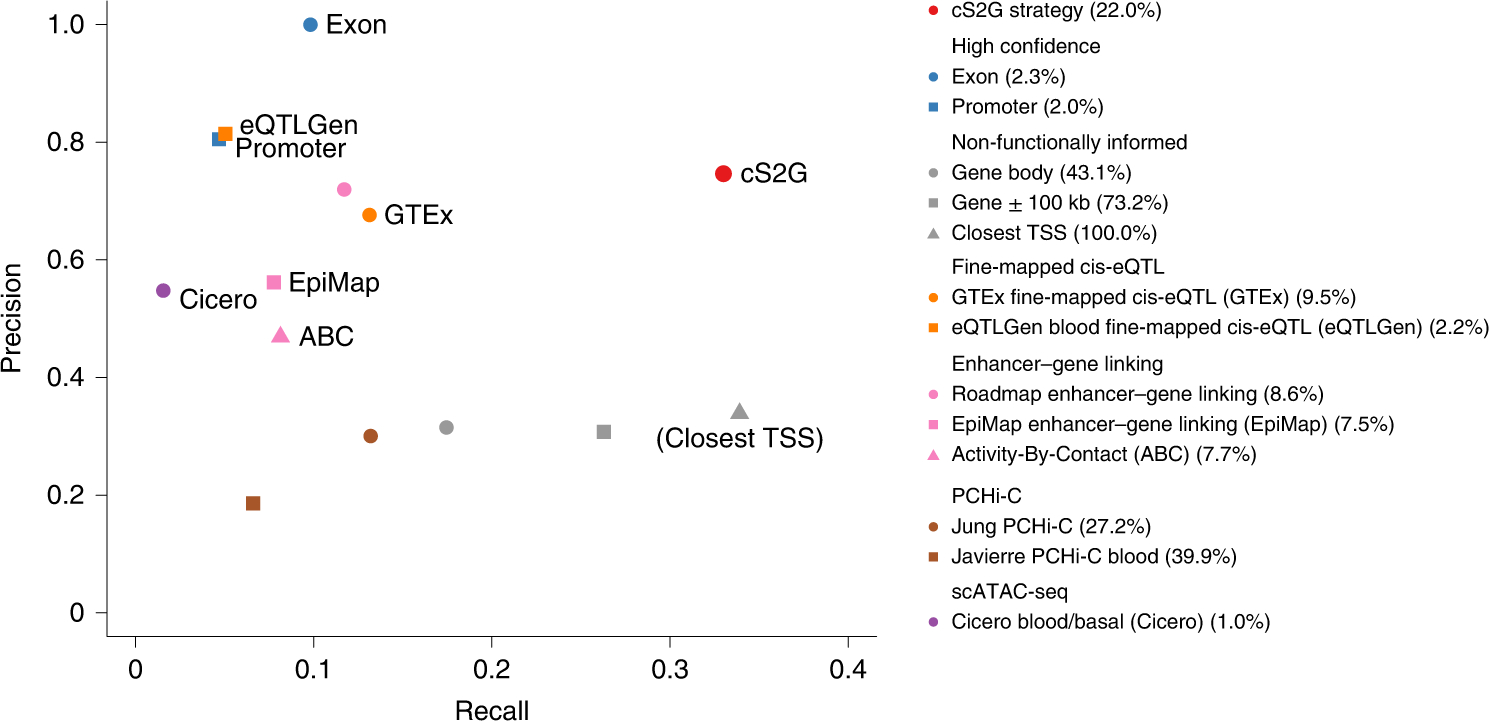
Figure 2: Accuracy of individual S2G strategies and combined S2G (cS2G) strategy.

We report the precision and recall of the 13 main S2G strategies from Table 1 and the cS2G strategy (estimated using trait-specific validation critical gene sets and meta-analyzed across 63 independent traits). Colored font denotes the cS2G strategy and its 7 constituent S2G strategies (gray font in parentheses denotes the Closest TSS strategy). Numbers in parentheses in legend denotes the proportion of common SNPs that are linked to at least one gene (as in Table 1). We note that our evaluation of these S2G strategies is impacted by their widely varying underlying biosample sizes (see Methods), in addition to differences in functional assays and SNP-to-gene linking methods. Standard errors are reported in Supplementary Figure 2, and numerical results are reported in Supplementary Table 5; standard errors for all S2G strategies linking >2.5% of common SNPs were ≤0.12 for precision and ≤0.03 for recall, with smaller standard errors for S2G strategies linking larger proportions of common SNPs.
