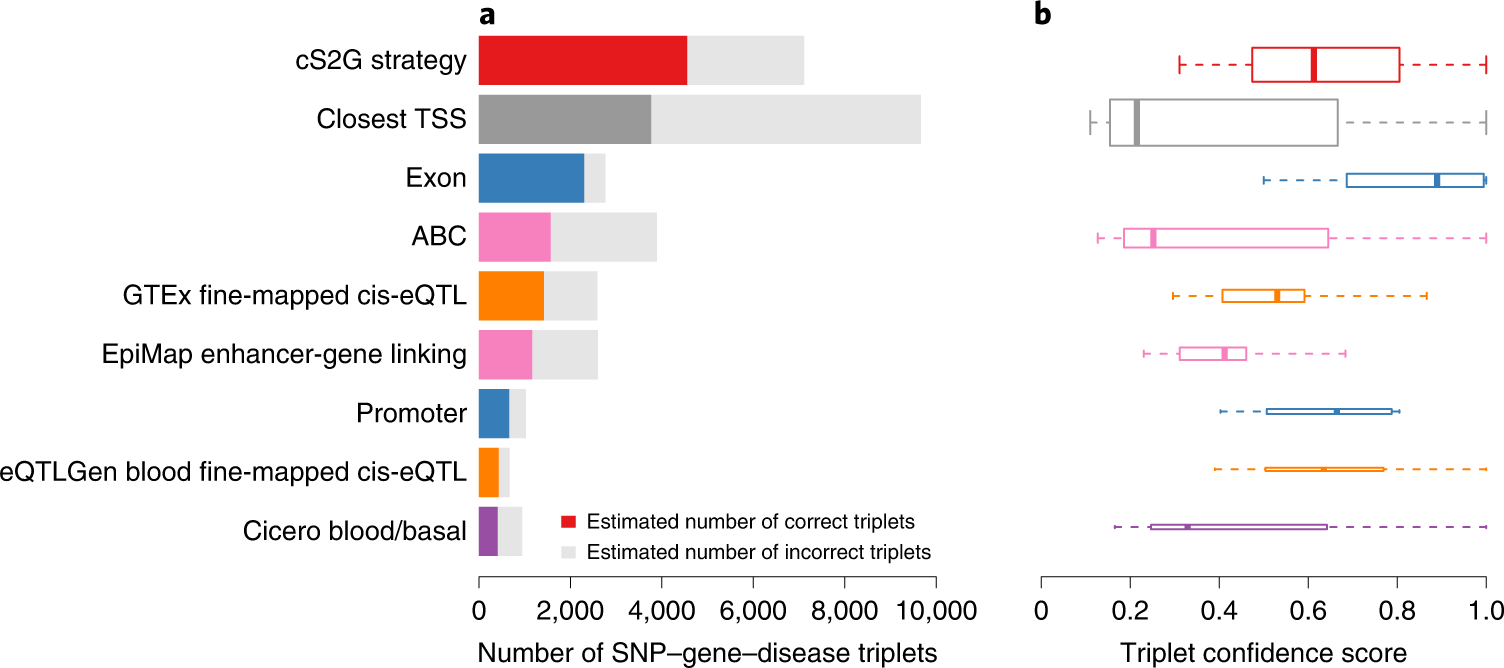
Figure 3: SNP-gene-disease triplets identified by cS2G and other S2G strategies.

(a) We report the number of SNP-gene-disease triplets identified by cS2G, its 7 constituent strategies, and the Closest TSS S2G strategy. For each strategy, we estimated the number of correct triplets based on the mean confidence score across triplets; the estimated number of correct triplets is denoted as a colored bar, and the estimated number of incorrect triplets is denoted as a grey bar. (b) We report the distribution of confidence scores of SNP-gene-disease triplets for each S2G strategy. The median value of confident scores is displayed as a band inside each box; boxes denote values in the second and third quartiles; the length of each whisker is 1.5 times the interquartile range, defined as the width of each box; the height of each box is proportional to the total number of triplets linked by each strategy (7,111, 9,664, 2,763, 3,889, 2,589, 2,604, 1,029, 674 and 943 for the 9 plotted S2G strategies). The list of SNP-gene-disease triplets predicted by cS2G is reported in Supplementary Table 17. Numerical results are reported in Supplementary Table 18.
