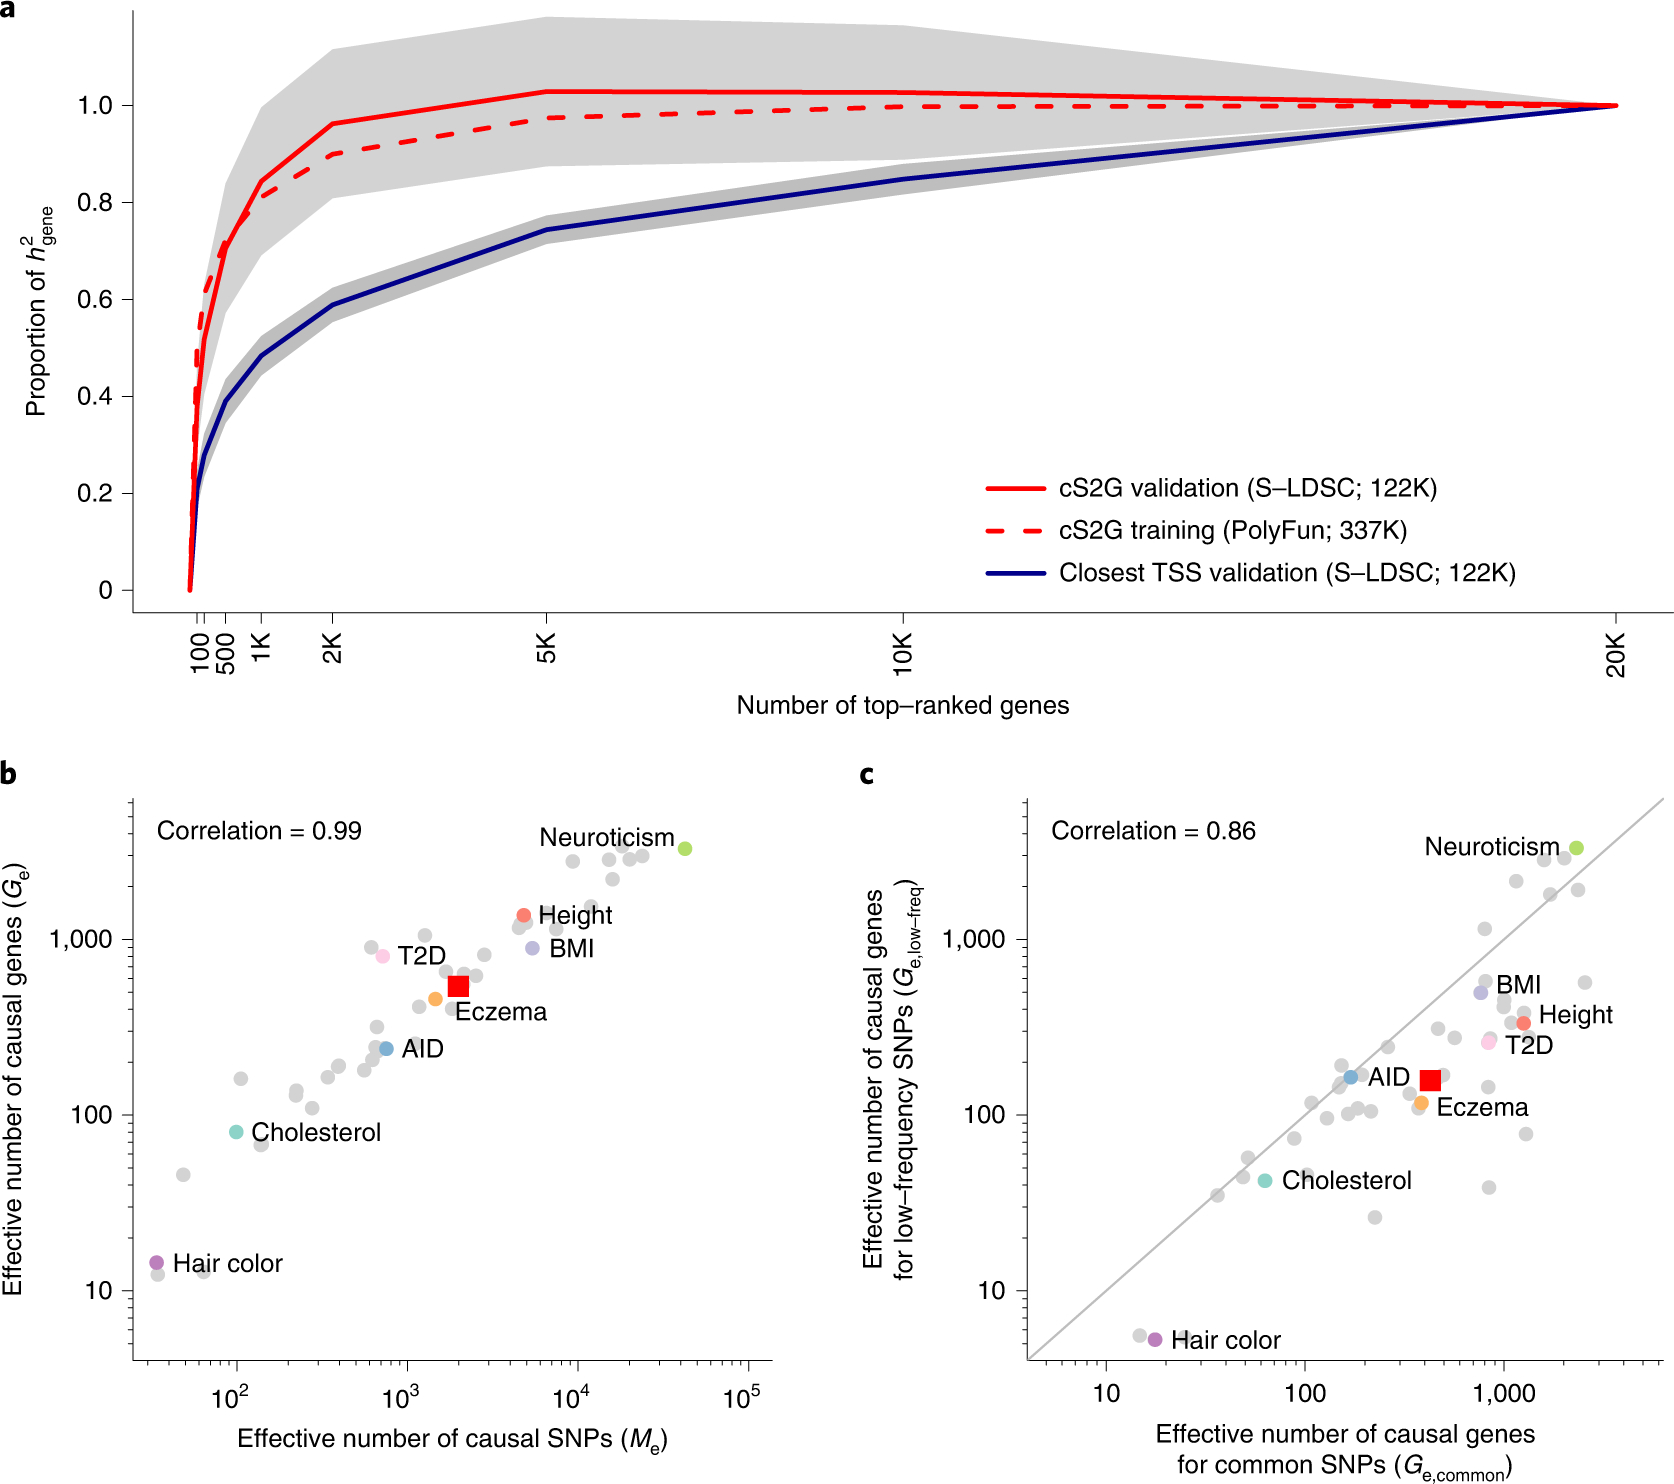
Figure 5: Empirical assessment of disease omnigenicity using cS2G.

(a) We report the proportion of SNP-heritability linked to genes (h2gene) explained by genes ranked by top per-gene h2, as inferred using three approaches (see text). Grey shading denotes 95% confidence intervals for cS2G-validation and Closest TSS-validation around meta-analyzed values. We forced the s.e. of the proportion of h2gene explained by all genes to be 0 (see Methods). We note that values greater than 1 are outside the biologically plausible 0–1 range, but allowing point estimates outside the biologically plausible 0–1 range is necessary to ensure unbiasedness. Results were meta-analyzed across 16 independent UK Biobank traits. (b) We report the effective number of causal SNPs54 (Me) and the effective number of causal genes (Ge) for 49 UK Biobank diseases/traits, with representative traits in colored font. (c) We report the effective number of causal genes for per-gene h2 linked to common SNPs (Ge,common) and the effective number of causal genes for per-gene h2 linked to low-frequency SNPs (Ge,low-frea) for 49 UK Biobank diseases/traits, with representative traits in colored font. In (b) and (c), red squares denote median values across 16 independent traits and correlations are computed on log-scale values. Numerical results are reported in Supplementary Table 22 and Supplementary Table 24. AID: Autoimmune disease; BMI: Body mass index; Cholesterol: Total cholesterol; T2D: Type 2 diabetes.
