
Extended Data Figure 2: Precision of 27 S2G strategies based on physical distance to TSS.
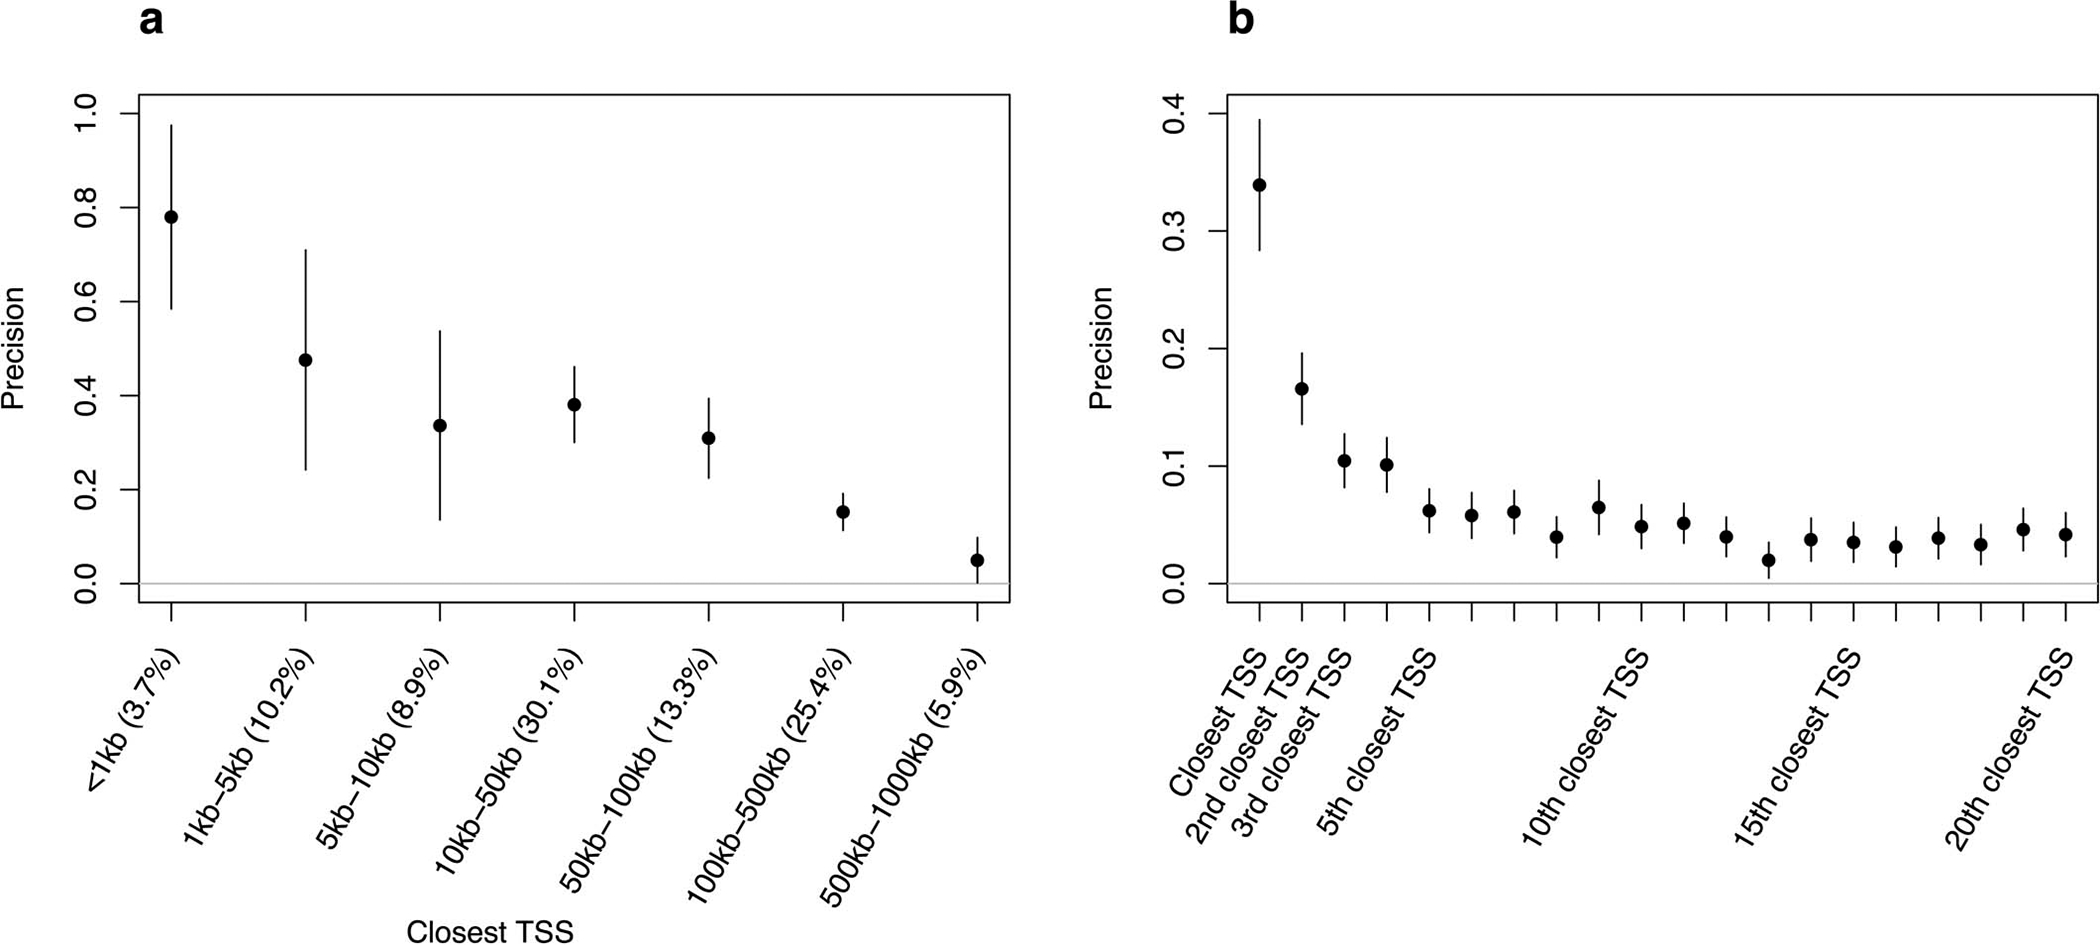
We report precision of the closest TSS strategy as a function of the distance between a SNP and its closest TSS (a) (numbers between parentheses represent the fraction of common SNPs linked by the strategy), and the precision of the ith closest TSS (each strategy links 100% of the SNPs) (b). Values were estimated using trait-specific validation critical gene sets and meta-analyzed across 63 independent traits. Error bars represent 95% confidence intervals around meta-analyzed values. The mean value of 0.043 for 6th-20th closest TSS suggests that genes located relatively close to causal disease genes have a slightly elevated probability of being causal. Numerical results including values of recall and corresponding standard errors are reported in Supplementary Table 5.