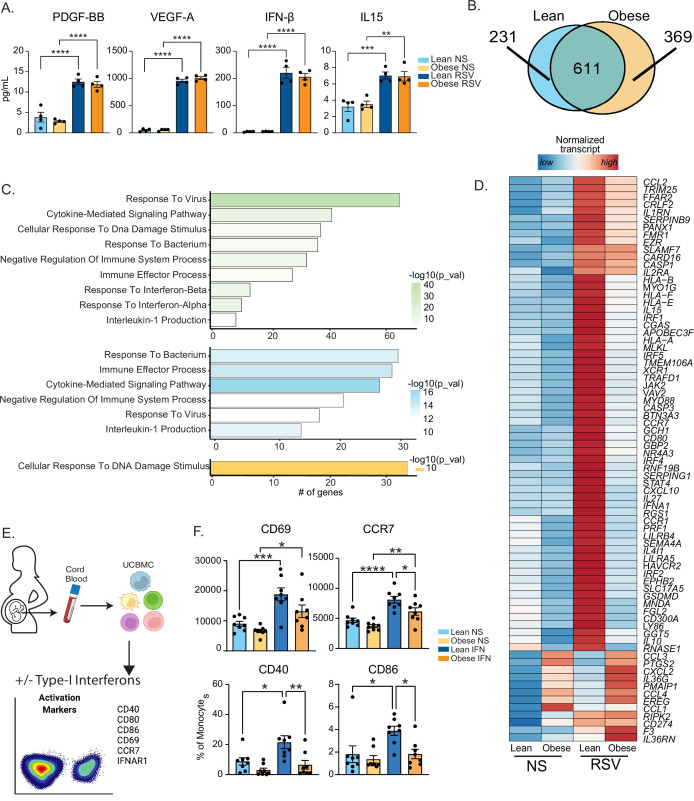
Figure 3. Maternal obesity does not alter acute anti-viral responses by cord blood monocytes but dampens responses to type-I interferon.
(A) Bar graphs comparing levels (mean and ± SEM) of key secreted factors by purified UCB monocytes in response to RSV infection measured using Luminex (n=4/group) compared to no stimulation (NS). (B) Venn diagram comparing DEG upregulated in response to RSV infection relative to no stim controls in lean and obese groups. (C) Functional enrichment of differentially expressed genes (DEG) detected in both groups (green, top), lean only (blue, middle), and obese group only (yellow, bottom) predicted using Metascape. (D) Heatmap comparing normalized transcript counts (blue – low to red – high) of genes exclusively upregulated in the lean group following RSV infection, mapping to GO terms ‘antigen processing and presentation’, ‘negative regulation of cell differentiation’, and ‘myeloid cell differentiation’. (E) Experimental design for testing monocyte responses to type-I IFN (n=8/group). UCBMC were stimulated with a mix of human IFNɑ and IFNβ for 16 hr and activation markers were measured using flow cytometry (n=7–8/group). (F) Bar graphs comparing activation markers on cord blood monocytes in response to type-I IFN. *- p<0.05, **- p<0.01, ***- p<0.001, ****-p<0.0001.


