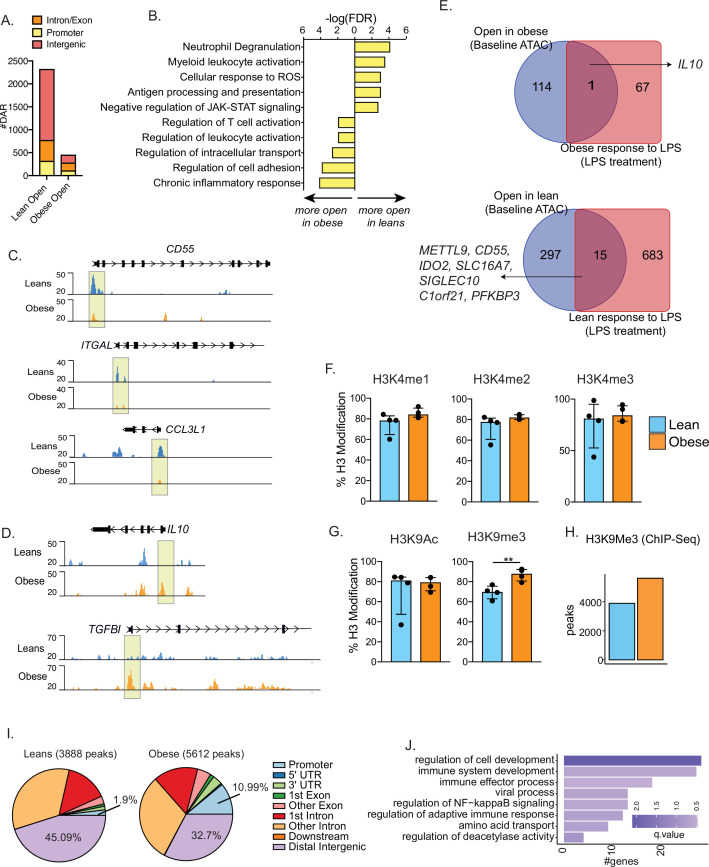
Figure 4. Epigenetic priming of cord blood monocytes with maternal obesity.
(A) Stacked bar graphs comparing genomic contexts of differentially accessible regions (DARs) open in one group relative to the other. (B) Functional enrichment of genes regulated by DARs overlapping promoters using Metascape. (C–D) Representative pileups of genes more accessible in (C) lean or (D) obese groups. (E) Venn diagrams comparing genes overlapping differentially accessible regions at baseline with gene expression changes following overnight LPS stimulation previously described in this cohort. (F–G) Bar graphs comparing key histone modifications in (F) Histone H3 lysine 4 residue and (G) Histone H3 lysine 9 residues from nuclear extracts of resting UCB monocytes (n=3–4/group). Y-axis represents the percentage signal relative to the total H3 signal detected. **- p<0.01.(H) Bar graph comparing the number of differential H3K9 trimethyl peaks between lean and obese groups at baseline. (I) Context specific annotation of differential H3K9me3 peaks in lean and obese group. (J) Functional enrichment of promoters associated H3K9me3 peaks enriched in obese group. Color of the bar is indicative of statistical significance of enrichment.

