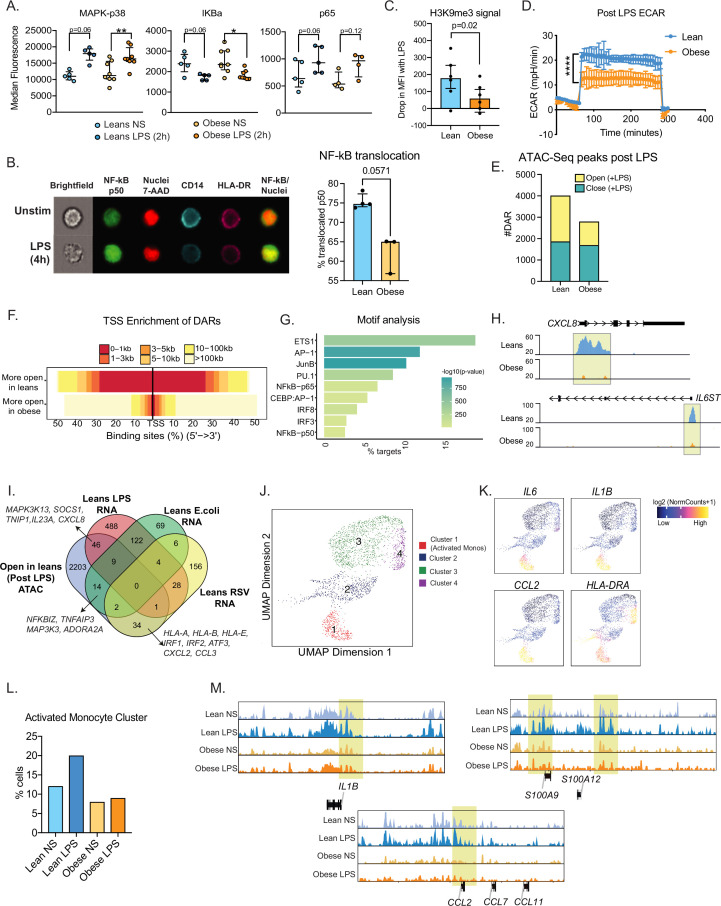
Figure 5. Epigenetic constraints to LPS stimulation in cord blood monocytes from babies born to mothers with obesity.
(A) Dot plots comparing median fluorescence intensity (MFI) ± SEM of phosphorylated signaling molecules downstream of TLR4 sensing (n=5/group). *- p<0.05, **- p<0.01. (B) Representative brightfield and fluorescent images of stimulated and unstimulated UCB monocytes profiled using imagine flow cytometry (n=3–4/group). NF-kB (p50–AF488) and nucleus (7-AAD) are shown in green and red respectively. Surface stains for CD14 and HLA-DR are shown in aqua and fuchsia respectively. Overlay of NF-kB and nuclei stain was used to determine translocation within CD14 + HLA-DR+monocytes. Bar graph comparing percentage translocated cells following LPS stimulation in lean and obese groups. (C) Bar graph comparing changes in trimethyl modification on H3K9 residues following LPS stimulation (relative to no stimulation controls) detected using flow cytometry. (D) Graph representing the kinetics of ECAR of stimulated monocytes following glucose injection and blockade of glycolysis. (E) Bar graph comparing DAR frequencies in each group following LPS stimulation. (F) Heatmap demonstrating overall accessibility differences following LPS stimulation around the promoter. (G) Over-represented transcription factors identified from motif analysis of DARs more open in lean compared to obese groups following LPS stimulation. X-axis represented percentage of peaks with motifs identified and color represents p-value on log10 scale (H) Pileups of key inflammatory loci post LPS stimulation (I) Four-way Venn of genes accessible (ATAC-Seq) exclusively in the lean group post LPS stimulation with genes exclusively upregulated (RNA-Seq) in the lean group following LPS, E. coli and RSV infection. Select overlapping genes are highlighted. (J) UMAP of single nuclei ATAC-Seq of LPS stimulated and sorted monocytes. (K) Feature plots demonstrating a cluster of activated monocytes (cluster 1). Color intensity represents fragments mapping to open chromatin regions. (L) Proportions of monocytes within each group mapping to activated monocyte cluster. (M) Pileups of inflammatory loci in activated monocytes with/without LPS stimulation. * - p<0.05; ** - p<0.01.


