. 2023 Feb 2;12:e82568. doi: 10.7554/eLife.82568

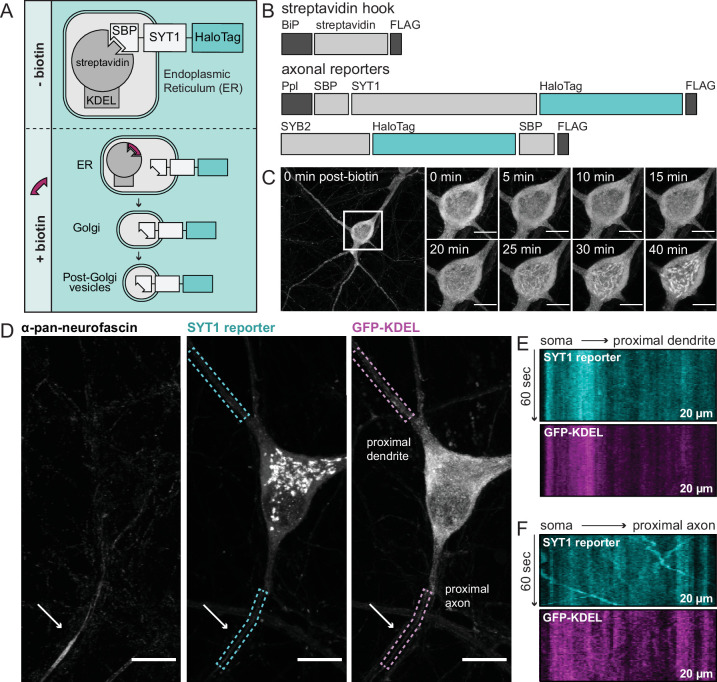
Figure 1. Using retention using selective hooks (RUSH) to study egress of synaptic vesicle (SV) proteins from the soma of cultured rat hippocampal neurons.

(A) A cartoon of RUSH; pre- and post-biotin conditions are shown. (B) Schematic of the streptavidin hook, and SYT1 and SYB2 reporter RUSH constructs: BiP, a signal peptide that drives translocation into the ER; FLAG, provides a means to detect each construct; SBP, streptavidin-binding peptide; Ppl, a pre-prolactin leader sequence to translocate the SBP into the endoplasmic reticulum (ER). In all cases the reporter is a HaloTag. (C) Representative super-resolution fluorescent live-cell MAX projection images from rat neurons at 15 days in vitro (DIV). Images of SYT1 reporter immediately after biotin addition with enlarged insets to detail the time course of release. Inset scale bar is 10 µm in panels (C–D). Since SYT1 and SYB2 behaved similarly, only SYT1 images are shown in panels (C–F). (D) Image of a neuron, 30 min after biotin addition, expressing the streptavidin hook, SYT1 reporter, and ER-targeted GFP (GFP-KDEL). Live-cell labeling with an anti-pan-neurofascin antibody was used to identify the axon initial segment (AIS; arrow); dendrites were identified by morphology and because they lacked an AIS. SYT1 was labeled with JF549 HaloTag ligand, and kymographs of this reporter, along with GFP-KDEL, were generated from the regions indicated by dashed boxes (20 µm long). Kymographs from a proximal dendrite (E) and proximal axon (F) are shown.

Figure 1.

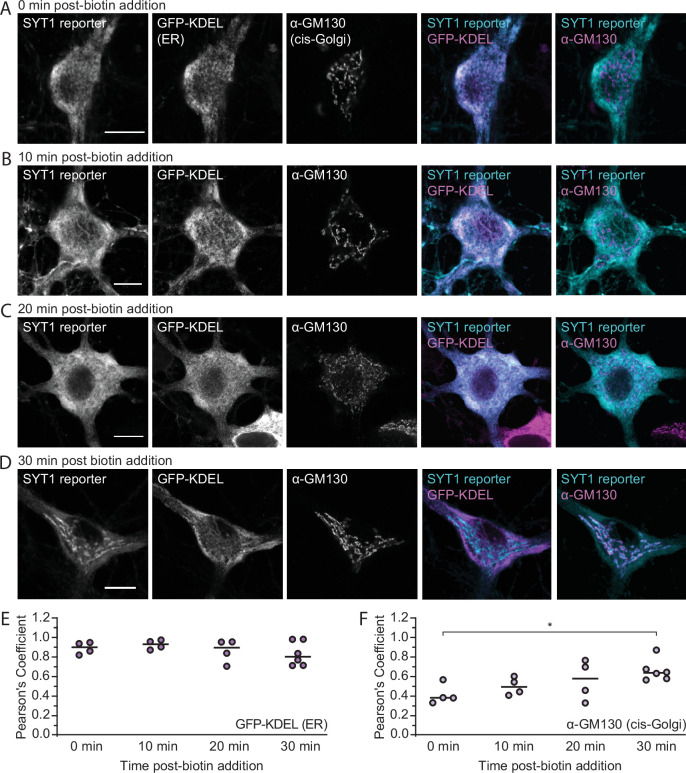
Figure 1—figure supplement 1. The SYT1 reporter localizes to the early secretory pathway after biotin addition.

Figure 1—figure supplement 1.

(A–D) Super-resolution, fixed-cell optical sections of 15 days in vitro (DIV) rat hippocampal neurons expressing the SYT1 reporter and endoplasmic reticulum (ER)-targeted GFP (GFP-KDEL), detailing the movement of the SYT1 reporter from the ER to the Golgi after biotin addition (0, 10, 20, and 30 min), as indicated. Scale bars represent 10 µm. (E, F) Quantification of overlap between the SYT1 reporter and ER (GFP-KDEL) or cis-Golgi (α-GM130 antibody) markers, respectively, over time; the median is indicated. A two-way ANOVA (p<0.0001) and subsequent Šídák’s multiple comparisons test was run to compare the Pearson’s coefficient between timepoints for the ER: p0 min vs. 10 min=0.99, p0 min vs. 20 min >0.99, p0 min vs. 30 min=0.98, p10 min vs. 20 min=0.97, p10 min vs. 30 min=0.80, p20 min vs. 30 min >0.99, and cis-Golgi: p0 min vs. 10 min=0.90, p0 min vs. 20 min=0.41, p0 min vs. 30 min=0.047, p10 min vs. 20 min=0.97, p10 min vs. 30 min=0.44, p20 min vs. 30 min=0.94.
Figure 1—figure supplement 2. The SYB2 reporter is retained in the endoplasmic reticulum prior to biotin addition.

Figure 1—figure supplement 2.

(A) Super-resolution, fixed-cell optical section of 14 days in vitro (DIV) rat hippocampal neurons expressing the SYB2 reporter and endoplasmic reticulum (ER)-targeted GFP (GFP-KDEL), indicating that the SYB2 reporter is retained in the ER prior to biotin addition. Scale bars represent 10 µm.
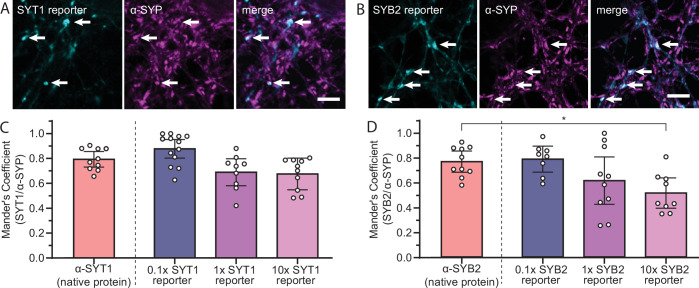
Figure 1—figure supplement 3. SYT1 and SYB2 reporters are targeted to the presynapse.

Figure 1—figure supplement 3.

(A) Super-resolution, fixed-cell optical sections of 15 days in vitro (DIV) rat hippocampal neurons expressing the SYT1 reporter, as visualized by the JF549 HaloTag ligand, and stained for α-synaptophysin (α-SYP) to confirm proper targeting to synapses. (B) Same as panel (A), but for the SYB2 reporter. Note that all neurons were stained for SYP, but only a few cells expressed the SYT1 or SYB2 reporter. Arrows denote colocalization. Scale bars represent 5 µm. (C) A Mander’s coefficient was calculated for native SYT1 (α-SYT1) or transduced SYT1 reporter, as visualized by the JF549 HaloTag ligand, overlapping with native SYP (α-SYP). A Kruskal-Wallis test (p=0.0043) and subsequent Dunn’s multiple comparisons test were conducted to compare the localization of the transduced reporter at various concentrations to that of the native protein (p0.1x SYT1 rep = 0.44, p1x SYT1 rep = 0.53, p10x SYT1 rep = 0.30). (D) Same as panel (C), but for SYB2. A one-way ANOVA (p=0.0083) and subsequent Dunnett’s multiple comparisons post-test were conducted comparing the localization of the transduced reporter to the native protein (p0.1x SYB2 rep = 0.99, p1x SYB2 rep = 0.17, p10x SYB2 rep = 0.013). In all cases, error bars represent the mean with 95% confidence intervals.