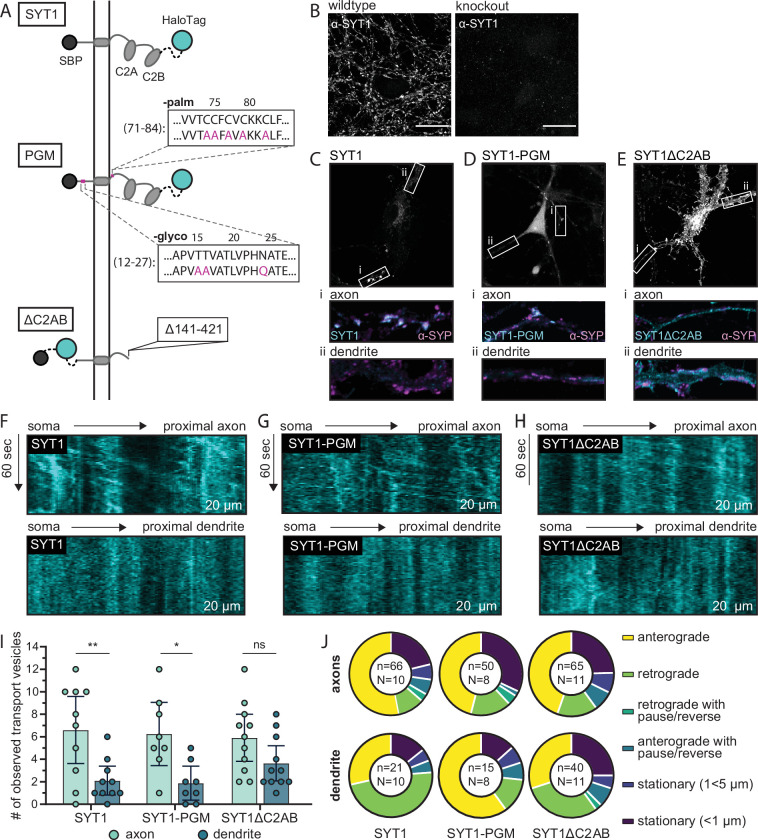
Figure 4. Molecular determinants that underlie the polarized transport of SYT1 to axons in mouse hippocampal neurons.
(A) Illustration of retention using selective hooks (RUSH) reporters used for these experiments: wild type (WT) SYT1 reporter, the SYT1 palmitoylation and glycosylation mutant (SYT1-PGM), and SYT1 truncated after position 140 (SYT1ΔC2AB). Each construct has a HaloTag for visualization. (B) ICC confirms the knockout of endogenous SYT1. For WT and knockout conditions, identical laser and gain settings were used. Scale bar represents 20 µm. (C–E) The endpoint localization of WT SYT1, SYT1-PGM, and SYT1ΔC2AB was visualized by labeling the appended HaloTag with JF549. The boxed regions were expanded and are shown below each panel to better reveal the localization of each construct in axons (i) and dendrites (ii), as compared to the α-SYP ICC signals. Note that all neurons were immunostained for SYP, but only a handful of cells expressed each SYT1 construct. ICC images were adjusted to the brightest area of the image to aid in visualization. All settings were kept consistent between corresponding axon/dendrite insets for a given cell and condition, and all images (B–E) were adjusted with linear brightness and contrast. Representative kymographs from proximal axons showing robust anterograde movement of the released SYT1 (F), SYT1-PGM (G), and SYT1ΔC2AB (H) reporters as compared to dendrites, demonstrating selective trafficking of WT and SYT1-PGM, but not SYT1∆C2AB, to axons. (I) The number of transport vesicles was plotted for each construct as the mean with 95% CI. A one-way ANOVA was run (p=0.0008), and a Šídák’s multiple comparisons test was used to compare transport in axons and dendrites of all three RUSH reporters. Significant differences in axonal vs. dendritic transport were observed for WT SYT1 (p=0.0097) and SYT-PGM (p=0.036), indicating polarized trafficking. In contrast, the transport of SYT1∆C2AB was not significantly polarized (p=0.49). A complete list of multiple comparisons results can be found in Figure 4—source data 1. Data were collected for 10 cells (SYT1), 8 cells (SYT1-PGM), or 11 cells (SYT1ΔC2AB), from four litters. Mean values and descriptive statistics are found in Figure 4—source data 2. (J) The movement of each transport vesicle categorized as anterograde, retrograde, retrograde with pause/reverse, anterograde with pause/reverse, stationary (1<5 µm), or stationary (<1 µm) and plotted as a fraction of the total number of transport vesicles observed for each compartment, for each construct. The total number of (n) transport vesicles from (N) cells are indicated. Exact fractions can be found in Figure 4—source data 3.
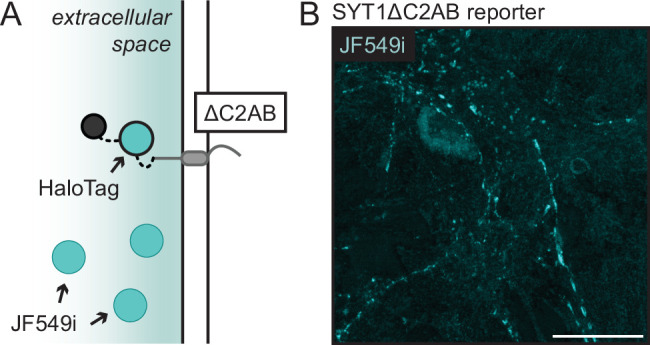
Figure 4—figure supplement 1. The SYT1ΔC2AB reporter is present on the plasma membrane.


