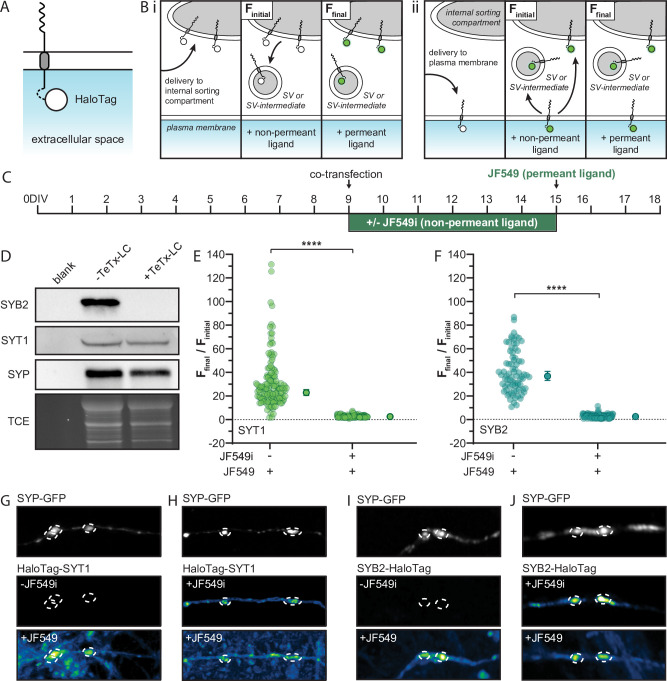
Figure 5. Transport vesicles deliver synaptic vesicle (SV) proteins to the presynaptic plasma membrane (PM) in rat hippocampal neurons, creating a depot for SV biogenesis.
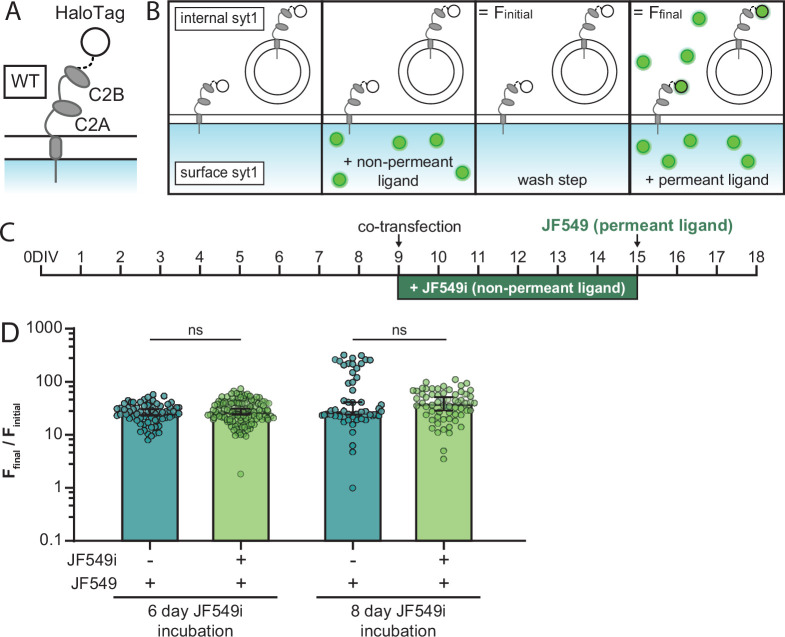
(A) Illustration of a generic integral membrane protein (representing SYT1 and SYB2) with a luminal HaloTag to allow for selective labeling at the PM. (B) Schematic of the HaloTag ligand (HTL) labeling protocol, shown within a nerve terminal, with the non-permeant ligand incubation step to label surface protein. If SYT1 and SYB2 are first delivered to an internal sorting compartment (i), rather than the PM (ii) prior to SV or SV-intermediate formation, they will not pass through the PM and so will not be labeled by the non-permeant ligand (green). Incubation with permeant ligand labels the remaining tagged protein and the resulting change in fluorescence denotes the efficiency of PM delivery. The signal from labeling with the non-permeant ligand was referred to as Finitial, where the unlabeled control coverslips still yielded a small background signal, producing a reproducible non-zero value that allowed us to calculate ratios. The subsequent signal after labeling with permeant ligand was called Ffinal. This labeling step included unbound ligand which, while weak and diffuse, results in a slight increase in the background signal. To counteract this, ROIs were drawn to include only the fluorescence intensity within the synapse. (C) Timeline for the transfection and labeling protocols. Briefly, cultured rat hippocampal neurons were transduced with TeTx-LC virus on 5 days in vitro (DIV) and then co-transfected on 9 DIV with HaloTag-SYT1 or SYB2-HaloTag, and SYP-GFP; the GFP construct was included to mark synapses and ‘dilute’ the HaloTag plasmid to achieve lower expression levels. Half of the coverslips were incubated in non-permeant HTL (JF549i) immediately after co-transfection to label any tagged protein that was delivered to the PM. Six days later (15 DIV) neurons were rinsed, imaged, and incubated with permeant ligand (JF549), to label any remaining tagged protein, and imaged again. (D) Immunoblot of cells transduced with a virus expressing TeTx-LC, resulting in the cleavage of endogenous SYB2 and the inhibition of SV recycling. We note that the SYB2 fusion protein used in these experiments harbored two point mutations to render it resistant to TeTx-LC (see Methods). Blots were probed for endogenous SYB2, SYT1, and SYP, with a TCE loading control. The normalized (Ffinal/Finitial) change in fluorescence intensity of the SYT1 (E) and SYB2 (F) fusion proteins upon adding permeant fluorescent ligand to cells grown with or without non-permeant ligand for 6 days; mean values with 95% CI are plotted to the right of each scatter plot. Data were analyzed with unpaired t-tests for both proteins; p-values = <0.0001. Panel (E) contains data from 156 synapses cultured in the presence of JF549i, and 136 synapses grown in the absence of this HTL. Data for both groups were from 8 fields of view from 4 different litters. Panel (F) contains data from 107 synapses cultured in the presence of JF549i, and 79 synapses grown in the absence of this HTL. Data for both groups were from five fields of view from three different litters. Mean values and descriptive statistics for SYT1 and SYB2 can be found in Figure 5—source data 1. Panels (G, H) are representative images of SYP-GFP to mark synapses (dashed circles), and the corresponding HaloTag-SYT1 signals under the indicated conditions; in the bottom panels the JF549 ligand was not washed away, resulting in a higher background. For all conditions, identical laser and gain settings were used. Any linear brightness and contrast adjustments were applied to all conditions. (I, J) Same as panels (G) and (H), but for SYB2-HaloTag.


