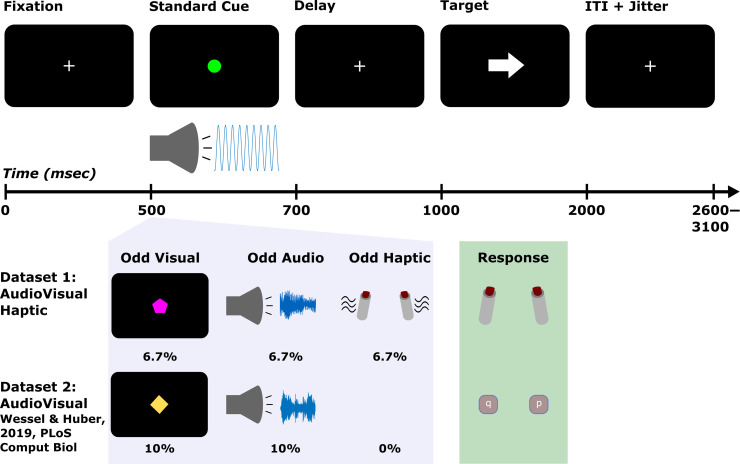
Figure 1. .
Task diagrams for the CMO tasks in Data Sets 1 and 2. The top row shows the timing and the display on standard cue trials (which were the same in both data sets). The standard cue consisted of a green circle and a 600-Hz pure tone. On trials with unexpected events, these were replaced by visual (unique shape/colors) or auditory novels (birdsong) or in the case of unexpected haptic events (in Data Set 1) the response devices participants held additionally vibrated. The light purple box illustrates examples of the unexpected events as well as their respective probabilities. The light green box depicts response devices (for Data Set 1, bilateral thumb presses, and for Data Set 2, bilateral index keypresses on a QWERTY keyboard).

