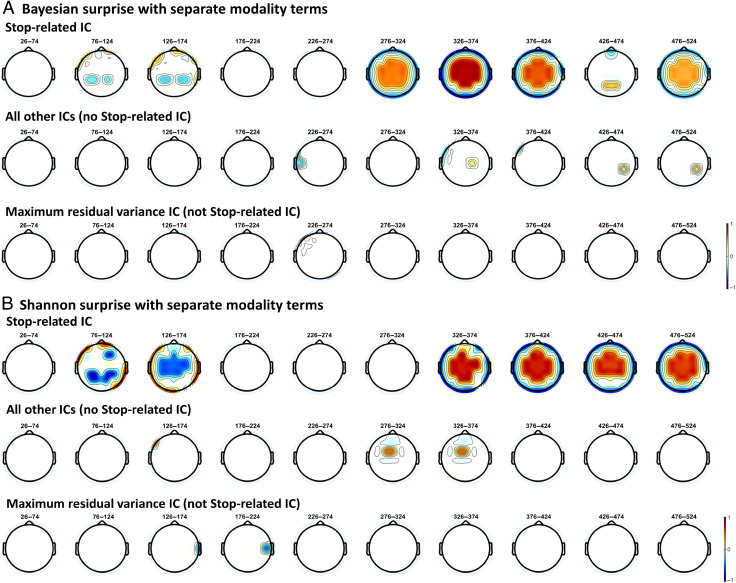
Figure A3. .
Scalp topographies of the ICs modeled with Bayesian surprise and Shannon surprise in the CMO task of Data Set 1 (n = 39). (A) Beta weights from the single-trial model-fitting of IC-EEG data with Bayesian surprise under the winning separate modality term model. Colors indicate significant model fits (warm colors = positive, cool colors = negative; white = nonsignificant, p = .01, FDR-corrected). (B) The same analyses but with Shannon surprise.

