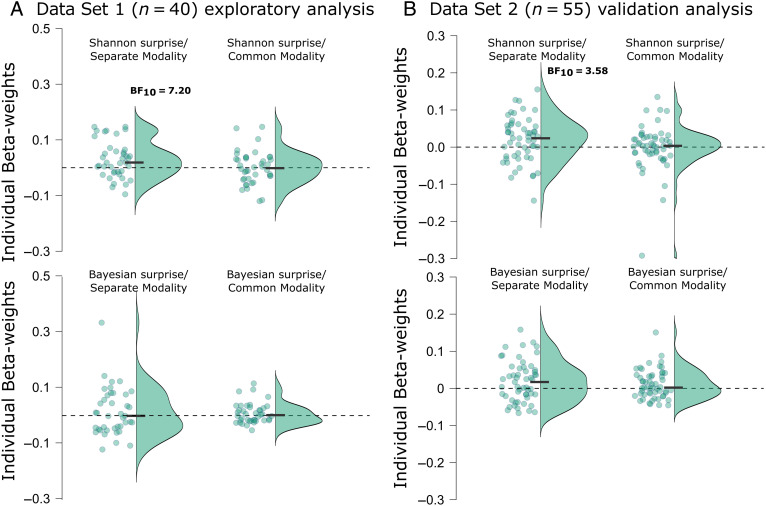
Figure 6. .
Individual beta weights from the various z-scored surprise single-trial model values fitted to z-scored β-bursts from 75 to 200 msec following unexpected events. (A) Points represent mean beta weights from individual participants estimated via robust regression for each surprise model in Data Set 1. Half violin plots depict the distribution of beta weights. Black bars indicate mean beta weights. (B) The same as in A but for Data Set 2, which was used to validate potential findings in Data Set 1. Reported BF10s correspond to moderate evidence in favor of the alternative hypothesis. BF10s < 3 are not shown here (but are reported in the main text).

