Figure 8. .
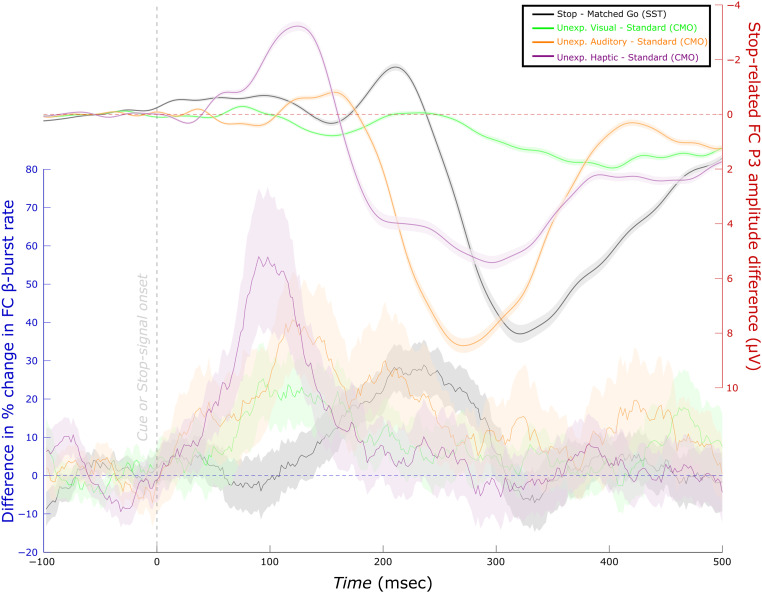
Time-course of differences in FC β-burst rate compared with FC P3 (Data Set 1, n = 39). (Left scale) Differences in the percent change in β-burst rate for successful stop trials compared with matched go trials (from Figure 7, but only involving Data Set 1 participants) as well as unexpected events relative to standard (from Figure 4). (Right scale) The same differences for FC P3. For this, the SST was used as a functional localizer to isolate an IC corresponding to the FC stop-signal P3 in the merged data set (i.e., the CMO and SST in Data Set 1). Visual inspection indicates that FC β-burst differences precede the corresponding FC P3 differences. Unexpected event differences generally also precede stop differences (excepting the FC P3 for unexpected visual events).

