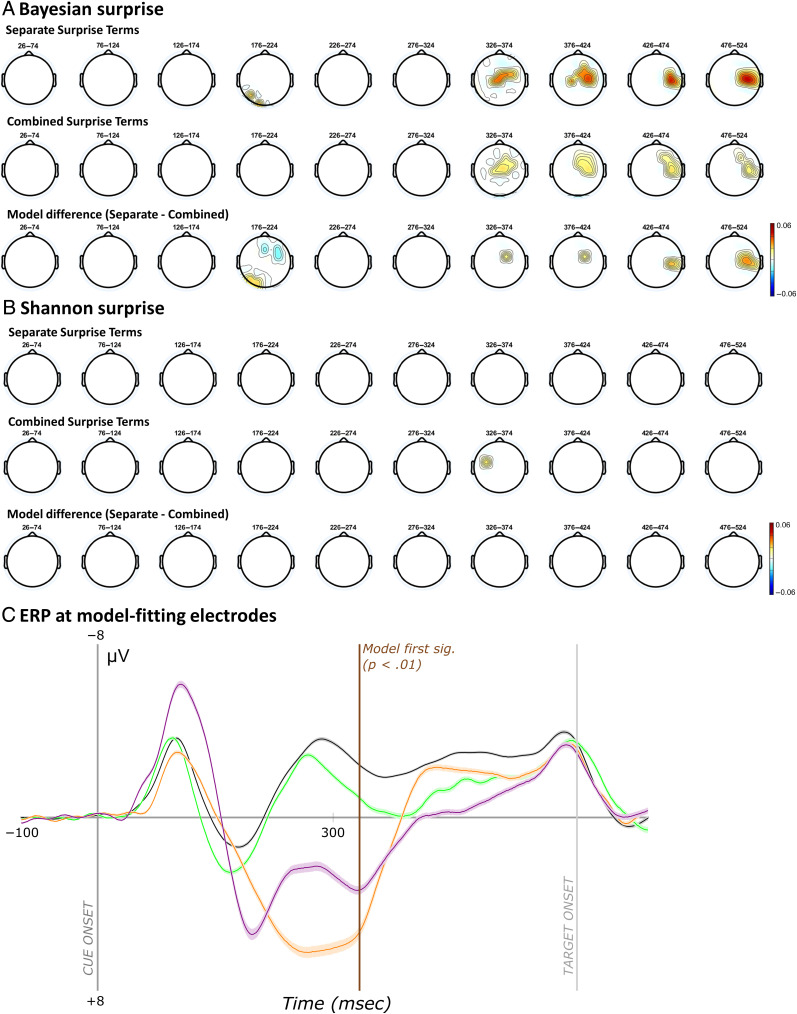
Figure A1. .
Scalp-topographies from modeling whole-brain single-trial EEG data with surprise and ERP at model-fitting electrodes in Data Set 1. (A) Topographies represent the mean standardized individual beta weights for Bayesian surprise and separate modality terms (top row), Bayesian surprise and combined modality terms (middle row), and the difference in fits between these two models (bottom row). Heatmaps reflect beta weights. (B) The same analyses as A but with Shannon surprise terms. (C) Cue-locked ERPs following each event type at model-fitting electrodes (FC2, C1, Cz, and C2) that were significant for the winning Bayesian surprise model and in Data Set 2. The spatiotemporal dynamics of the model-fitting electrodes correspond to the FC P3.

