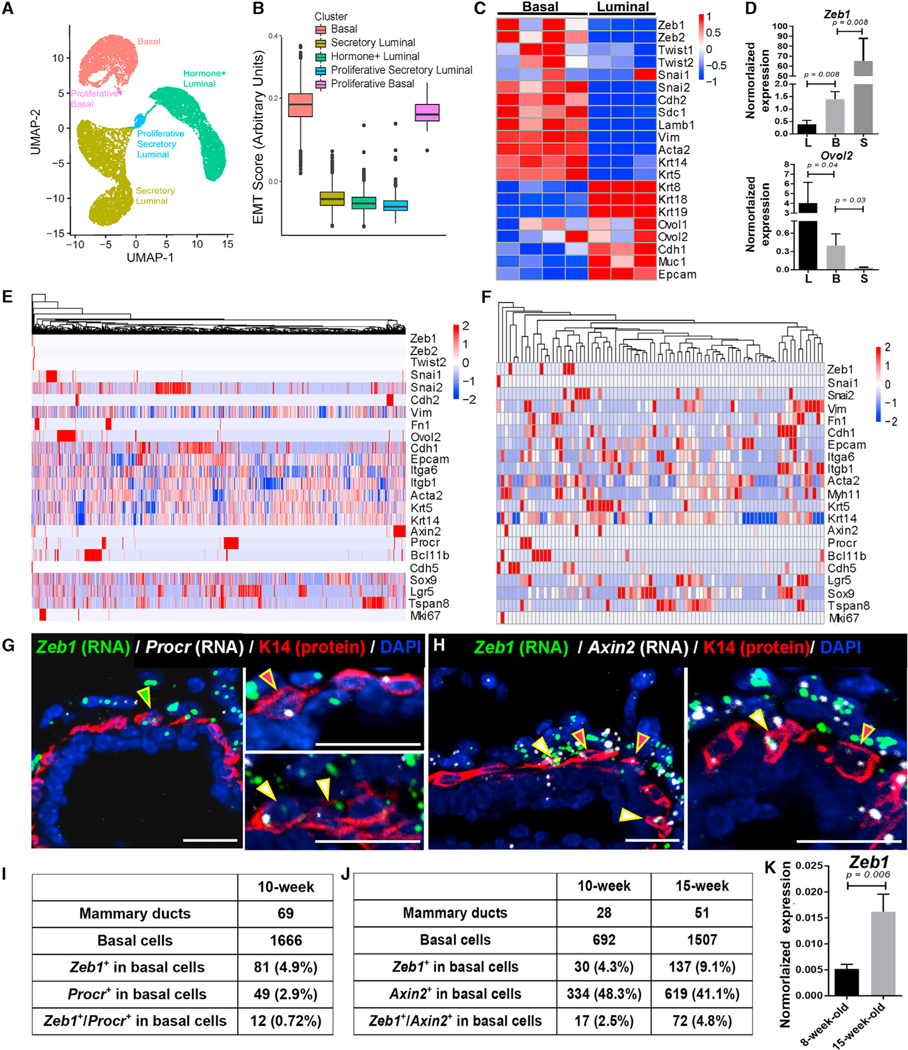
Figure 1. Expression of EMT-associated genes and identification of Zeb1-expressing basal cells in the mammary epithelium.
(A) Uniform Manifold Approximation and Projection (UMAP) of the distinct epithelial cell clusters identified in 8- to 9-week-old MGs.
(B) Boxplots displaying differential expression of an EMT gene signature in the identified cell clusters. See Table S2 for the list of genes used for scoring.
(C) Heatmap of DNA microarray data (Gu et al., 2013) showing differential expression of the indicated genes in Lin−CD24+CD49high basal and Lin−CD24+CD49low luminal cells from 8- to 12-week-old mice.
(D) qRT-PCR analysis of Zeb1 and Ovol2 expression in Lin−CD49fhighEpCAM+ basal, Lin−CD49fhighEpCAM high luminal, and Lin−CD49flowEpCAM− stromal cell populations from 12-week-old mice (n = 3).
(E and F) Heatmaps showing the expression enrichment of individual EMT-associated genes and known SC markers in basal MECs sequenced with the 10× (E) or C1 (F) platform. The color code shows the expression level in each cell relative to the average expression level in all cells (e.g., red indicates a cell that expresses a higher level of a particular gene than the average and white indicates the average).
(G and H) RNAScope images showing co-analysis of Zeb1 with Procr (G) or Axin2 (H) mRNAs in MGs from 10-week-old mice. K14 antibody highlights the basal MECs. DAPI stains the nuclei. Arrowheads point to the cells positive for one or both signals.
(I and J) Quantitative analysis of the RNAScope data on MGs from 10-week-old or 15-week-old (see Figure S1H) mice.
(K) qRT-PCR analysis of Zeb1 expression in Lin−CD49fhighEpCAM+ basal MECs from 8-week-old or 15-week-old mice (n = 3 each).
Scale bars: 50 μm in (G) and (H). See also Figure S1 and Tables S1, S2, S4, and S5.

