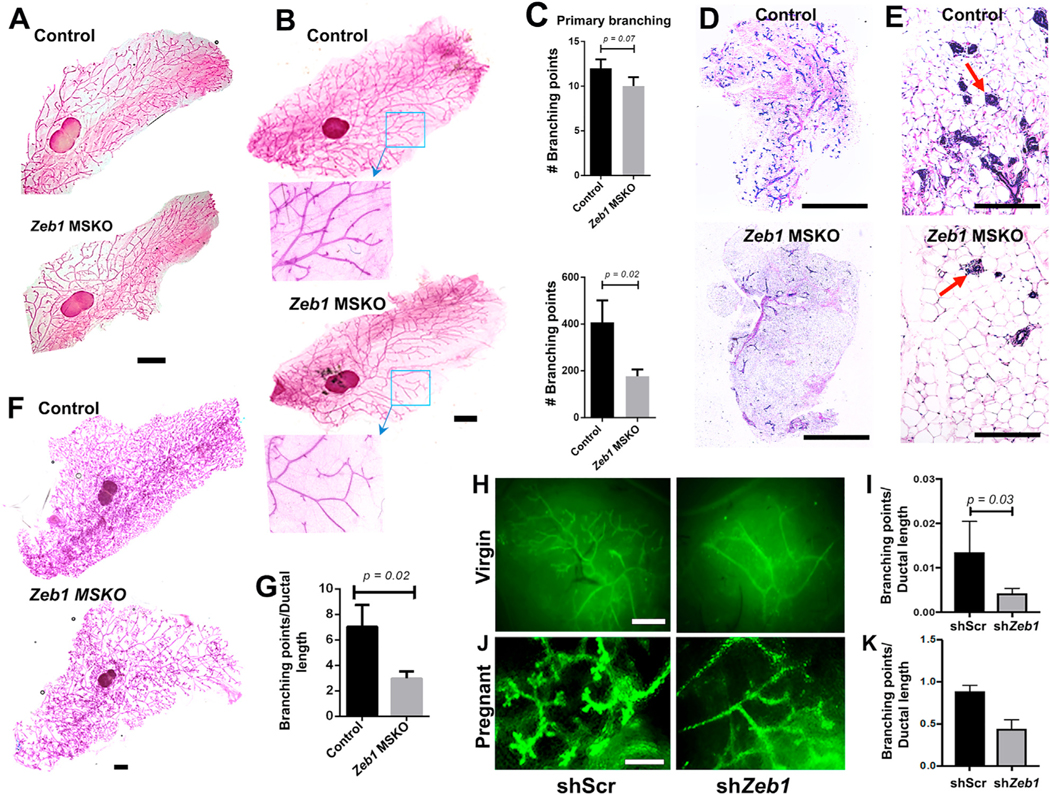
Figure 2. MEC-specific Zeb1 deficiency compromises ductal branching morphogenesis (A–C) Whole-mount analysis of MGs from 8-week-old.
(A) and 17-week-old (B and C) virgin K14-Cre;Zeb1f/+ (control) and K14-Cre;Zeb1f/f (MSKO) mice. Boxed areas in (B) are shown at higher magnification.
(D and E) H&E images of MGs from 17-week-old virgin control and MSKO mice. Arrows indicate individual ductal sections.
(F and G) Whole-mount analysis of MGs from pregnant (P14.5) control and MSKO mice. Representative images are shown in (A), (B), and (F), and quantification from multiple pairs are shown in (C) (n = 3) and (G) (n = 3).
(H–K) Results of cleared fat pad transplantation of FACS-sorted basal MECs infected with lentiviruses that express shScr or shZeb1. (H) and (J) show representative images of transplants from virgin hosts analyzed at 8 weeks after transplantation (H) or hosts that were subsequently mated to WT males (J). (I) and (K) show summary of data for (H) (n = 5) and (J) (n = 2), respectively. Data presented here were obtained using shZeb1-1, and similar results were obtained using shZeb1-2 (Figures S2J–S2M).
Scale bars: 5 mm in (A), (B), and (F), 1 mm in (D), 100 μm in (E), and 5 mm in (H) and (J). See also Figure S2.

