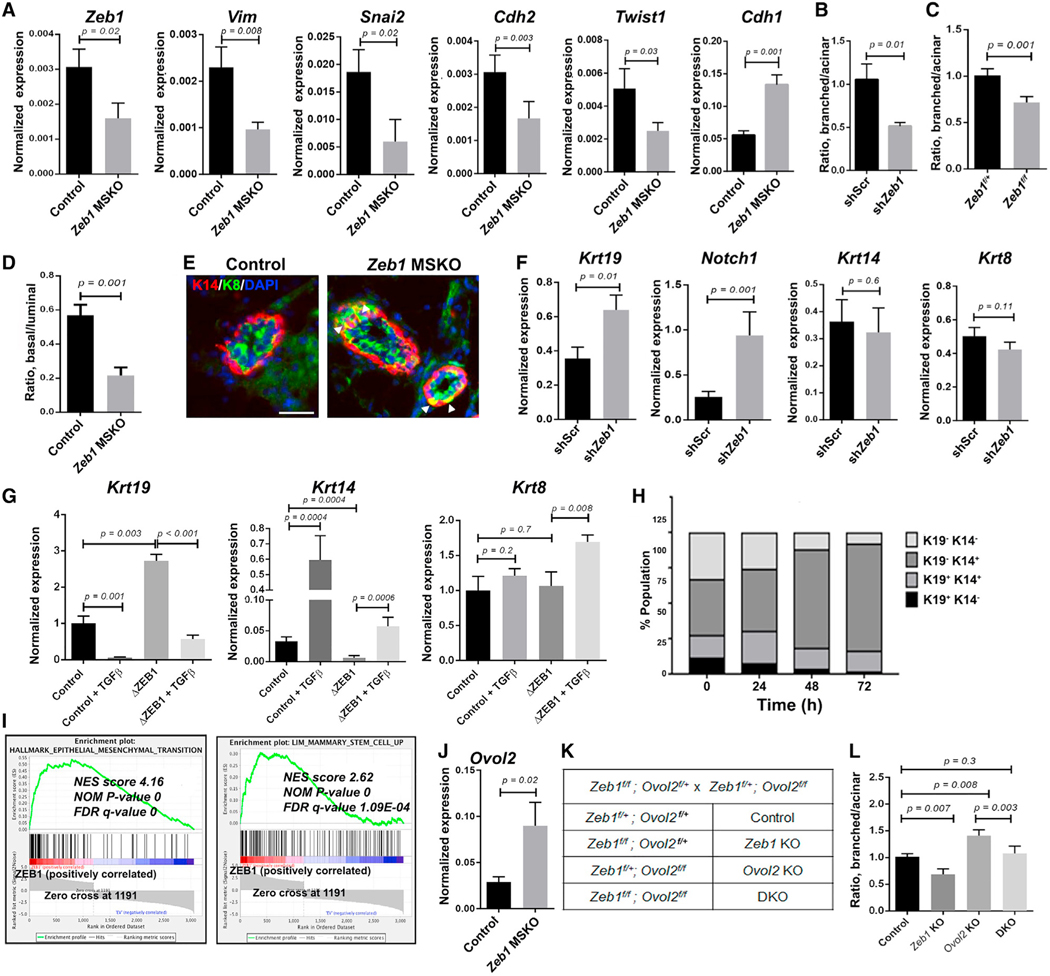
Figure 3. Zeb1/ZEB1 controls basal-luminal balance through EMT-related gene regulation.
(A) qRT-PCR analysis of the indicated genes in FACS-sorted basal MECs from 8- to 9-week-old females.
(B) Quantification of organoid types generated by control and Zeb1-depleted MECs. Data presented here were obtained using shZeb1-1, and similar results were obtained using shZeb1-2 (see Figures S3C and S3D).
(C) Quantification of organoid types generated by Ade-Cre-infected Zeb1f/+ or Zeb1f/f MECs. Data in (B) and (C) are from 3 to 4 independent experiments, respectively.
(D) Flow cytometry quantification of the ratio between basal and luminal MECs in MGs from 12- to 17-week-old Zeb1 MSKO virgin females and control littermates (n = 5 pairs). See Figure S3H for representative flow plots and absolute cell number.
(E) K14/K8 immunostaining of MGs from 15-week-old Zeb1 MSKO virgin females and control littermates. Arrowheads indicate K14/K8 double-positive cells in the basal layer. DAPI stains the nuclei. See Figure S3J for summary of data from n = 3 pairs. Scale bar: 50 μm.
(F) qRT-PCR analysis of the indicated genes in control and Zeb1-depleted organoids as in (B).
(G) qRT-PCR analysis of the indicated genes in control and ZEB1-deleted MCF10A cells. Data are presented as the mean ± standard deviation (SD).
(H) Analysis of keratin protein expression in MCF10A cells at different time points after induction of Zeb1 overexpression.
(I) Gene set enrichment analysis (GSEA) of RNA-seq data on MCF10A cells (see Table S3 for a complete list of genes used for analysis). FDR, false discovery rate; NES, normalized enrichment score; NOM, nominal.
(J) qRT-PCR analysis of Ovol2 expression in control and Zeb1 MSKO basal MECs.
(K and L) Organoid formation by control, Zeb1 single, Ovol2 single, and Zeb1/Ovol2 double KO (DKO) MECs. Breeding strategy and mouse genotypes are shown in (K), and results of quantification are shown in (L) (n = 3 for each).

