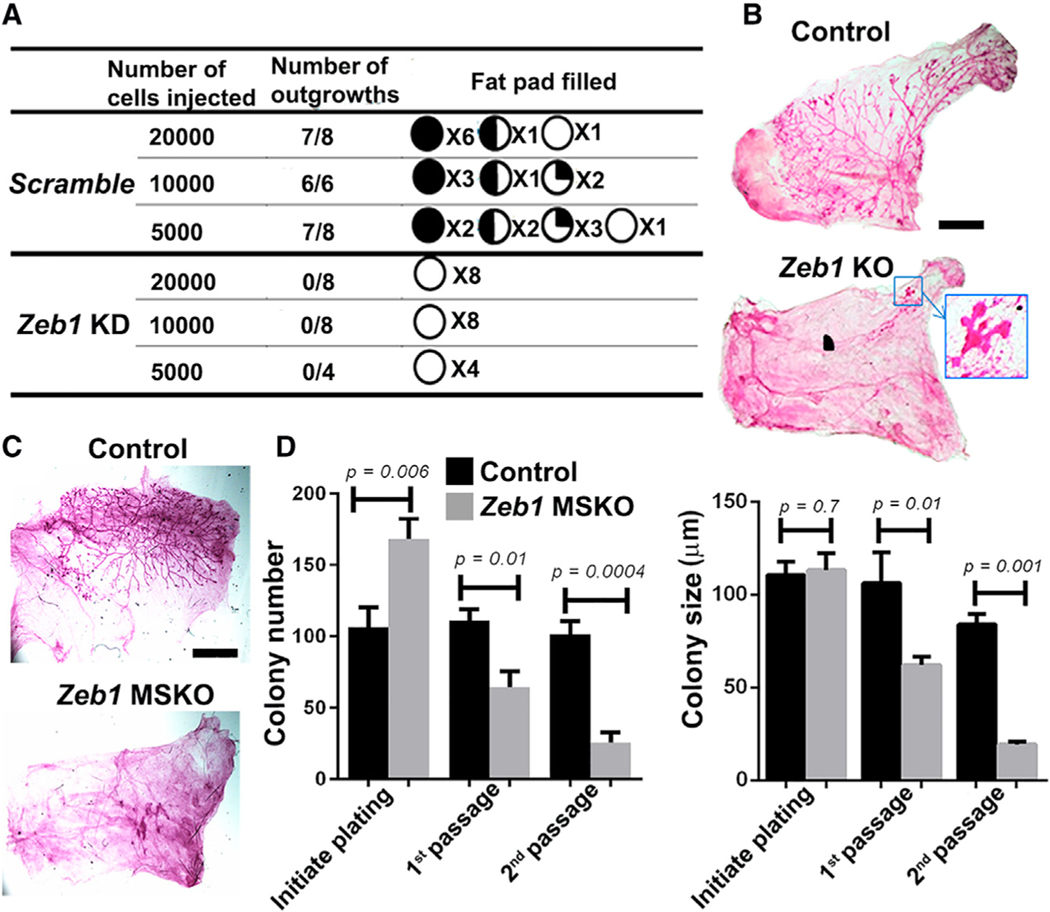
Figure 4. Basal MECs require Zeb1 for regeneration in vivo and clonogenicity ex vivo.
(A) Limiting dilution transplantation of control and Zeb1-depleted basal MECs. The pie charts show approximate take rate and percent fat pad filled by the mammary outgrowths.
(B) Transplants derived from Ade-Cre-infected (GFP+) basal MECs from 8-week-old Zeb1f/+ (control) and Zeb1f/f (KO) mice. See Figure S4B for additional replicates. Boxed area in (B) is shown at higher magnification.
(C) Transplants derived from basal MECs from 8-week-old control and Zeb1 MSKO mice. Data are representative of n = 3 pairs.
(D) Colony formation by basal MECs from 8-week-old control and Zeb1 MSKO mice. Shown is a summary from 3 independent experiments. Scale bars: 5 mm in (B) and (C). See Figure S4D for representative colony images.

