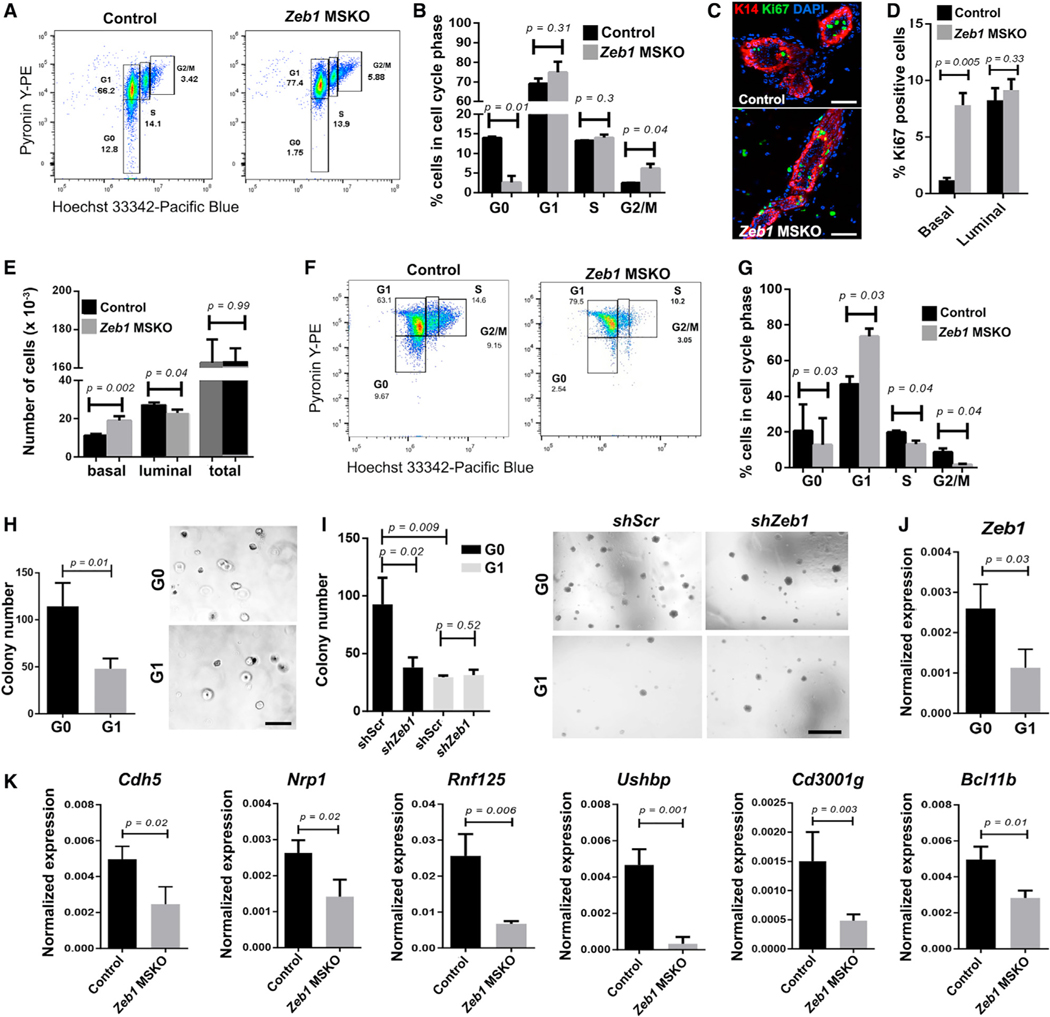
Figure 5. Zeb1-deficient basal MECs exhibit defects in cell cycle, quiescence, and G0-associated gene expression.
(A and B) Cell cycle analysis of basal MECs from 8- to 9-week-old control and Zeb1 MSKO mice. Shown are represented FACS profiles of one pair (A) and summary of data from 4 pairs (B) of mice.
(C and D) Ki67 immunostaining in MGs of 8-week-old control and Zeb1 MSKO mice. Representative images are shown in (C), and summary of data from 3 pairs of mice is shown in (D). K14 antibody stains the basal layer, and DAPI stains the nuclei.
(E) Quantification of the numbers of basal and luminal cells in MGs from 8- to 9-week-old control and Zeb1 MSKO mice (n = 6 each).
(F and G) Cell cycle analysis of basal MECs in 12-week-old control and Zeb1 MSKO mice. n = 3 in (G). Boxes in (A) and (F) indicate gating information.
(H and I) Colony formation by G0 and G1 basal MECs with (I, shZeb1) or without (H, untreated; I, shScr) Zeb1 depletion. n = 3 each.
(J) qRT-PCR analysis of Zeb1 expression in sorted G0 and G1 cells. n = 3 each.
(K) qRT-PCR analysis of the indicated genes in basal MECs from 8-week-old control and Zeb1 MSKO mice. n = 3 pairs.
Scale bars: 50 μm in (C), 500 mm in (H), and 500 μm in (I). See also Figure S5 and Table S7.

