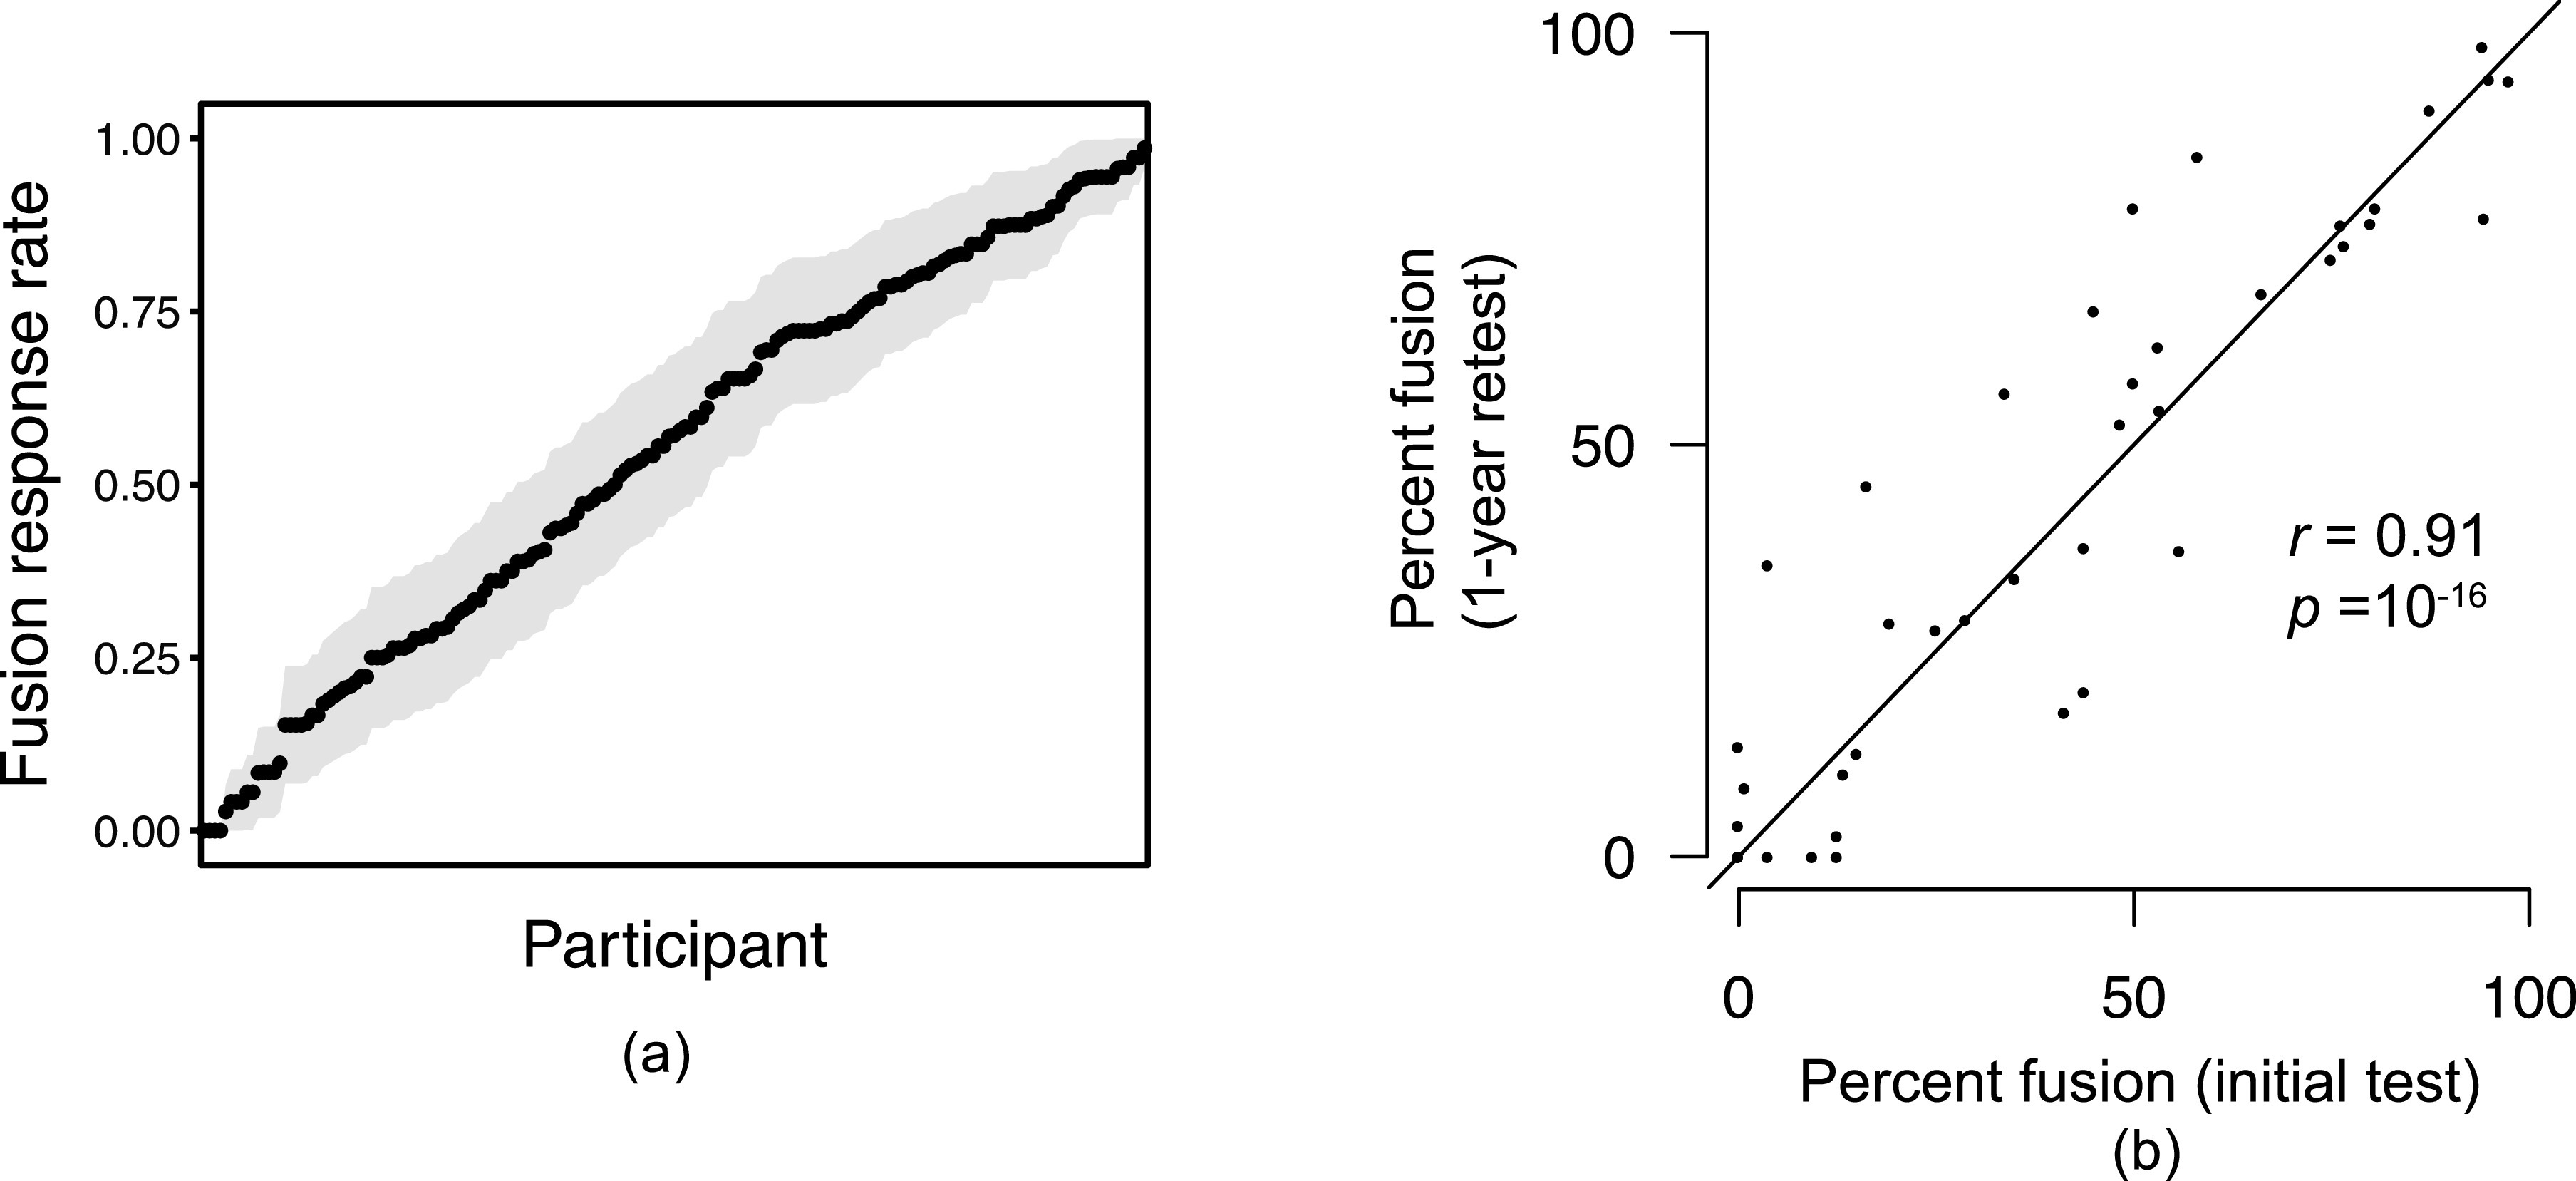
FIG. 1.

(Color online) (a) Individual variability in susceptibility to the McGurk effect (Brown et al., 2018). Shaded regions represent two standard errors for each participant's fusion rate. (b) Reliability of individual susceptibility to the McGurk effect on separate testing occasions separated by one year (Basu Mallick et al., 2015).
