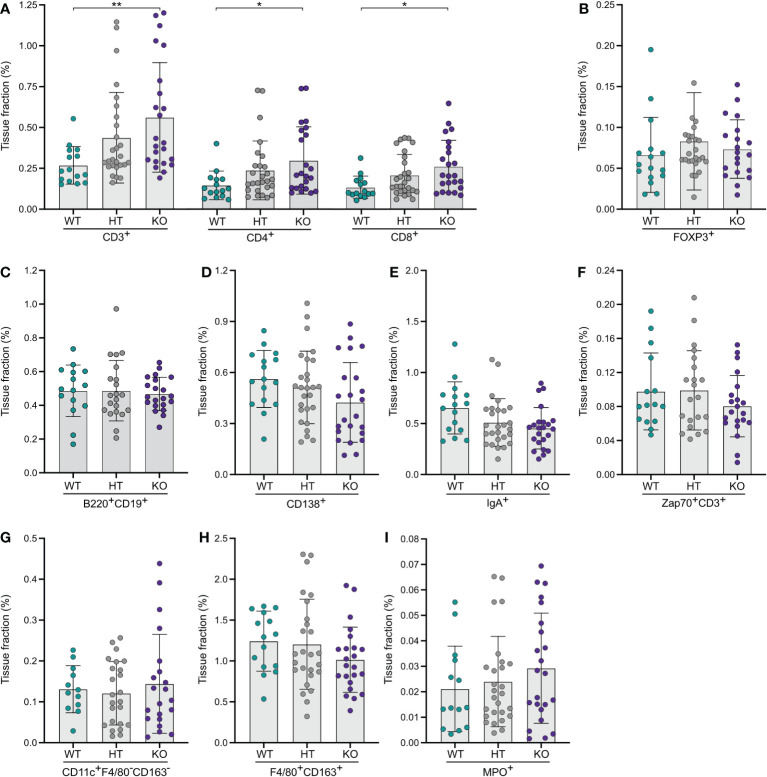
Figure 2.
Quantitative analyses of immune cells in the large intestinal mucosa of NPP7 KO mice showed a doubling in T-lymphocyte numbers. Large intestines from NPP7 HT and KO mice, and WT mice, were stained for various immune cell populations by immunohistochemistry. Computerized image analysis was used to quantify positivity (stained fraction of tissue area) reflecting cell numbers. (A) CD3ε+, CD4+ and CD8α+ T-lymphocytes; (B) Foxp3+ Tregs; (C) B-lymphocytes; (D) CD138+ plasma cells; (E) IgA+ cells; (F) Zap70+CD3ε− NK cells; (G) CD11c+F4/80−CD163− DCs; (H) Macrophages; and (I) MPO+ neutrophils. Each dot represents an individual mouse and is the mean of two staining experiments. Columns show the group mean ± SD. *P<0.05, **P<0.001.

