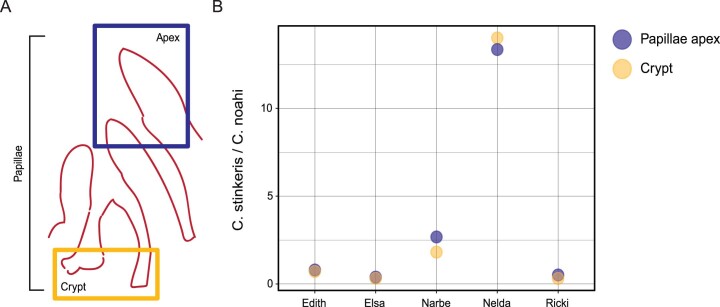
Extended Data Fig. 8. The ratio of ‘Ca. C. stinkeris’ to ‘Ca. C.noahi’ at two different locations along the papillae.
a) Cartoon based on a representative photomicrograph85 of rumen papillae to show the two sections that were dissected from papillae biopsies. From these, DNA was extracted, and the populations were measured using dPCR. b) The ratios of the populations are plotted as we hypothesized divergent distributions of the two populations across the papillae. Individual data points are shown and there was no significant difference between the apex and crypt samples (two-sample t-test, P = 0.98). The names on the x-axis are the names of the different animals (n = 5) from which we obtained the papillae samples.

