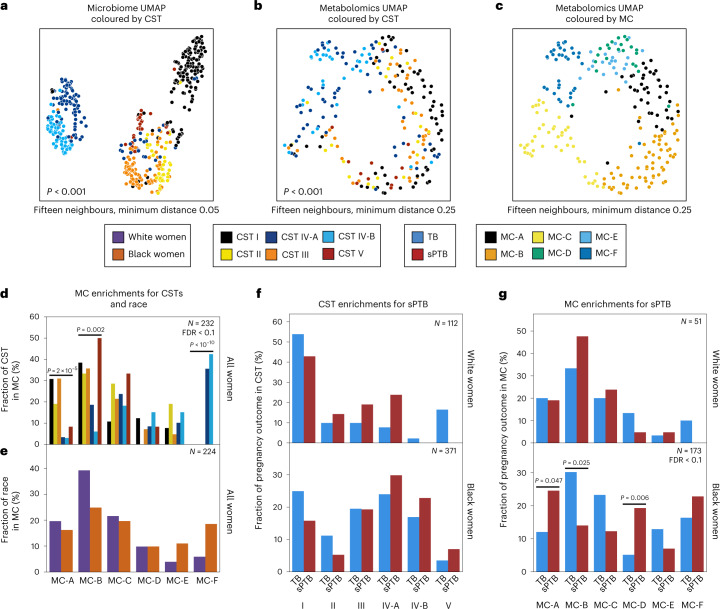
Fig. 1. Vaginal metabolome clusters are associated with PTB.
a–c, UMAP ordination of microbiome (a, N = 503) and metabolomics data (b and c, N = 232), coloured by CSTs (a and b) or de novo clustering of metabolites data (c, MCs; Methods). The vaginal microbiome and metabolome are significantly separated by CSTs (PERMANOVA P < 0.001 for both), yet the separation is less clear in the metabolome. For similar plots coloured by maternal race, see also Extended Data Fig. 4c,d. d, The fraction of women whose metabolite profiles clustered to each MC, shown for each CST separately. e, Similar to d but shown for Black and White women separately. f, The fraction of White (top) and Black (bottom) women whose microbiomes belonged to each CST, separated by pregnancy outcome. g, Similar to f, for the fraction of women whose metabolomes clustered to each MC. We show a significant association of sPTB with MCs A, B and D among Black women (P = 0.047, P = 0.025 and P = 0.006, respectively, q < 0.1). Number above horizontal lines in d–g is two-sided Fisher’s exact P, q < 0.1.

