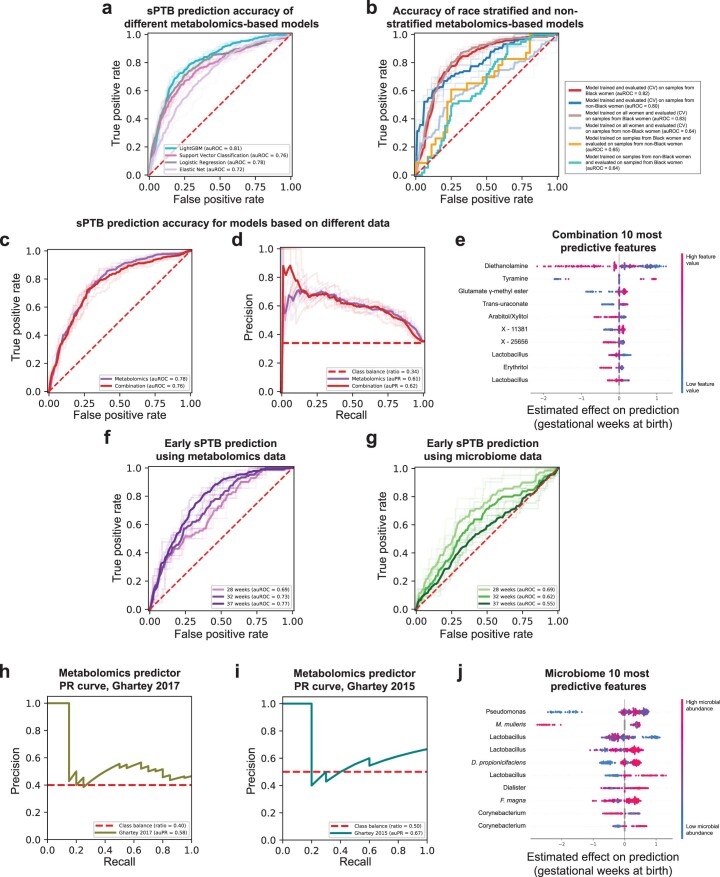
Extended Data Fig. 8. Performance and features of prediction models for sPTB.
a, Receiver operating characteristic (ROC) curve comparing the performance of different sPTB prediction algorithms on metabolomics data. LightGBM (auROC = 0.81) outperforms logistic regression (auROC = 0.78, P = 0.017 for auROC comparison against LightGBM), support vector classification (auROC = 0.76, P = 2.9 × 10⁻⁴) and elastic net (auROC = 0.72, P = 0.004). b, ROC curve comparing the performance of a composite model stratified for race against a model trained on all samples. A model trained on samples from all women achieves the same accuracy as a model trained only on samples from Black women when evaluated in 10-fold cross-validation on sPTB prediction for Black women (auROC of 0.83 and 0.82, respectively). However, a model trained on samples from all women significantly underperforms a model trained only on samples from women who do not identify as Black when evaluated in 10-fold cross-validation on the same subgroup (auROC of 0.64 vs. 0.80, P = 4 × 10⁻⁷ for auROC comparison). Demonstrating that a different model is learned on each subgroup, models trained separately on each subgroup do not generalize as well to the other subgroup (auROC of 0.64 and 0.65). c, d, ROC (c) and precision-recall (PR; d) curves, evaluated in nested cross-validation, comparing sPTB prediction accuracy for models based on metabolomics data alone (auROC = 0.78, auPR = 0.61), and on metabolomics data combined with microbiome and clinical data (‘combination’; auROC = 0.76, auPR = 0.62; P = 0.44). e, SHAP83-based effect on total prediction (x-axis) for the top 10 features used in our combination models, sorted with descending importance. Each dot represents a sample, with the color corresponding to the metabolite level in the sample compared to all samples. f, g, ROC curves for the same metabolome-based (f) and microbiome-based (g) models as in Fig. 4a,b, when prediction is evaluated for extremely (<28 weeks of gestation) and very (<32 weeks) PTB. The microbiome-based models show increasing accuracy for predicting extremely and very PTB (auROC of 0.69 and 0.62, respectively, compared to auROC of 0.55 for all sPTB, P = 0.03 and P = 0.49, respectively). h, i, PR curve for sPTB prediction on two external cohorts, obtained using our metabolome-based predictor without retraining or adaptation. j, Same as (e) for the microbiome-based model. Shaded lines in a–d, f, g show results from five independent 10-fold cross validation draws (Methods). p-values for comparisons between ROC curves are based on the two-sided test described in ref. 117.

