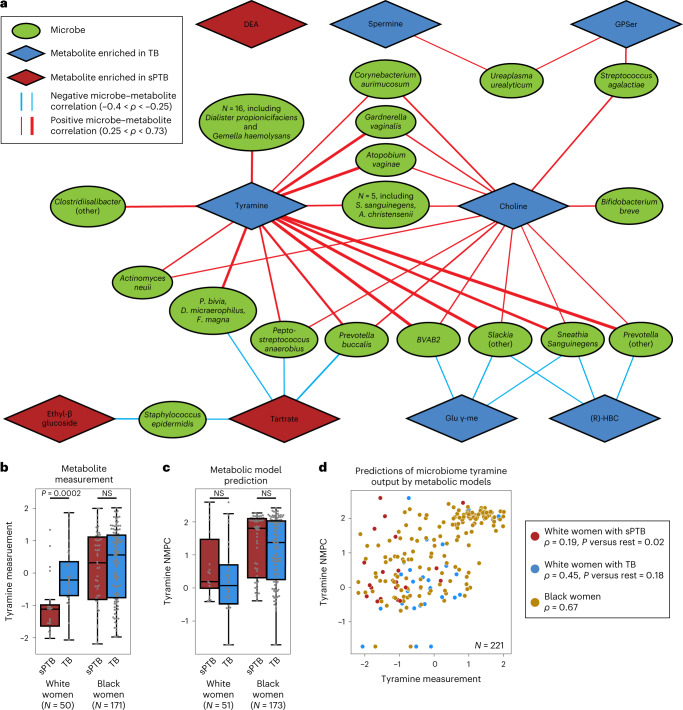
Fig. 3. Microbe–metabolite correlations and metabolic models suggest sources for sPTB-associated metabolites.
a, A network of microbial correlations with metabolites associated with sPTB. Ellipses, microbial species; blue and red diamonds, metabolites enriched in TB and sPTB, respectively; blue and red edges, negative and positive Spearman correlations with FDR < 0.1, |ρ| > 0.25, respectively; edge width, median ρ. For the same network without grouped nodes, see Extended Data Fig. 6a. b,c, Box and swarm plots (line, median; box, IQR; whiskers, 1.5× IQR) of tyramine levels, as measured (b) and predicted with metabolic models (Methods; c), comparing preterm and term deliveries and stratifying by maternal self-identified race. White women who delivered preterm had lower measured vaginal levels of tyramine (P = 0.0002), yet our metabolic models predict higher, albeit non-statistically significant, microbiome production of tyramine in women who delivered preterm (P = 0.18 and P = 0.26 for all and White women, respectively). P, Two-sided Mann–Whitney U. d, Tyramine production derived from microbiome metabolic models (NMPC; Methods; Y axis) plotted against measured tyramine levels (X axis) and coloured by race and birth outcome (legend). While our models are generally accurate for tyramine (Spearman ρ = 0.62, P < 10−10 across all women), the accuracy for White women who delivered preterm was significantly lower (Spearman ρ = 0.19, P = 0.02 for comparing correlation strength versus the correlation in other women, two-sided Fisher R-to-z transform), suggesting a difference in strains, functional capacity, or a non-microbial interaction not captured by our models.

