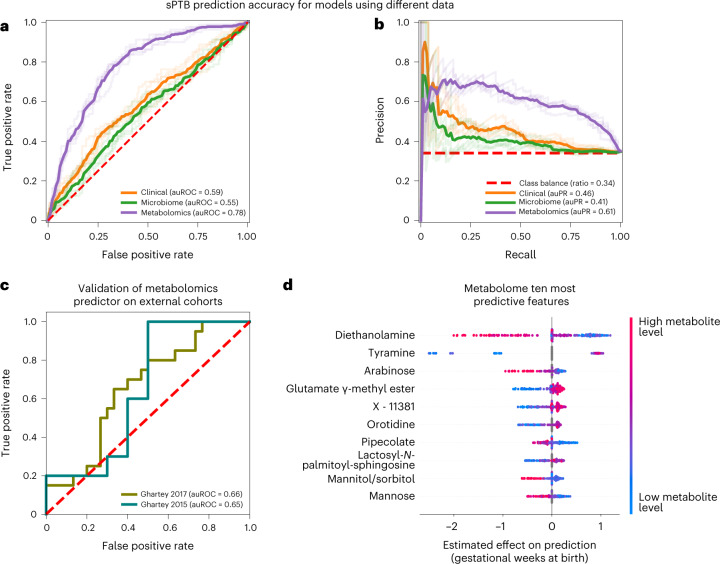
Fig. 4. Metabolomics-based prediction of subsequent sPTB.
a,b, Receiver operating characteristic (ROC, a) and precision-recall (PR, b) curves comparing sPTB prediction accuracy for models based on clinical (auROC = 0.59, auPR = 0.46), microbiome (auROC = 0.55, auPR = 0.41) and metabolomics (auROC = 0.78, auPR = 0.61) data (legend), evaluated in nested cross-validation (Methods). N = 232 for all. Shaded lines show results from five independent outer 10-fold cross-validation draws (Methods). c, ROC curve evaluating the performance of our metabolomics-based predictor on two external cohorts. Despite a challenging replication setting, with different inclusion criteria, measured metabolites and batch effects, our predictor obtains relatively accurate predictions without retraining (auROC = 0.66, auROC = 0.65, for the Ghartey 2017 (N = 50) and 2015 (N = 20) cohorts, respectively; Methods). d, Effect on total prediction (SHAP-based83; X axis) for the ten most predictive metabolites in our metabolome-based predictor, sorted with descending importance. Each dot represents a specific sample, with the colour corresponding to the relative level of the metabolite in the sample compared with all other samples.

