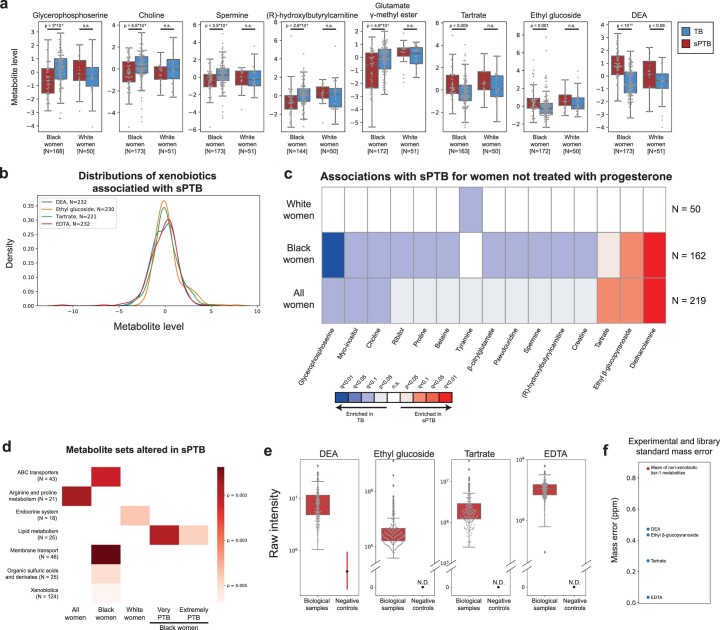
Extended Data Fig. 5. Metabolites altered in sPTB.
a, Box and swarm plots (line, median; box, IQR; whiskers, 1.5*IQR) of the levels of metabolites associated with sPTB, comparing preterm and term deliveries and stratifying by maternal self-identified race. P – two-sided Mann-Whitney U. b, Distribution (kernel density estimation) of four xenobiotics associated with sPTB or early sPTB across this cohort. Samples with no metabolite detected are excluded. c, Same as Fig. 2a, for women not treated with progesterone. d, Heatmap showing metabolite sets altered in sPTB in various subsets of this cohort. Colors correspond to two-sided p-value of metabolite set enrichment analysis (Methods). Only associations with FDR < 0.1 are shown. e, Raw intensity levels measured across samples for the same four xenobiotics as in b, compared to measures from plate negative process controls. Box mid-line, median; box, IQR; whiskers, 1.5*IQR; vertical line, min:max range; dot, mean; N.D., not detected. N = 232 for Diethanolamine; N = 230 for ethyl glucoside; N = 221 for tartrate; N = 232 for EDTA. f, Mass error for spectral matching (y-axis) for the same xenobiotics, compared to the mean mass error for all non-xenobiotic, tier 1 metabolites, showing that the four xenobiotic metabolites had very good identification quality.

