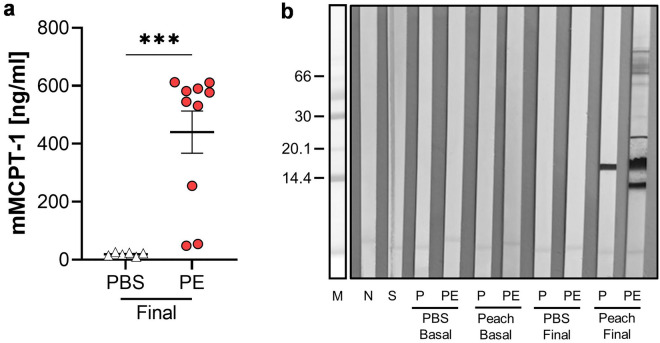
Figure 4.
mMCPT-1 levels and IgG reactivity in serum. Levels of (a) mMCPT-1 were analyzed in the serum of the mice after (final) provocation via ELISA. (b) Peach extract (PE) and nPru p 3 (P) were subjected to SDS-PAGE followed by immunoblot analysis using serum pools from the experimental groups before (basal) or after provocation (final). n = 6–10, data presented as combination of 2 experiments performed under identical settings; ***p < 0.001.

