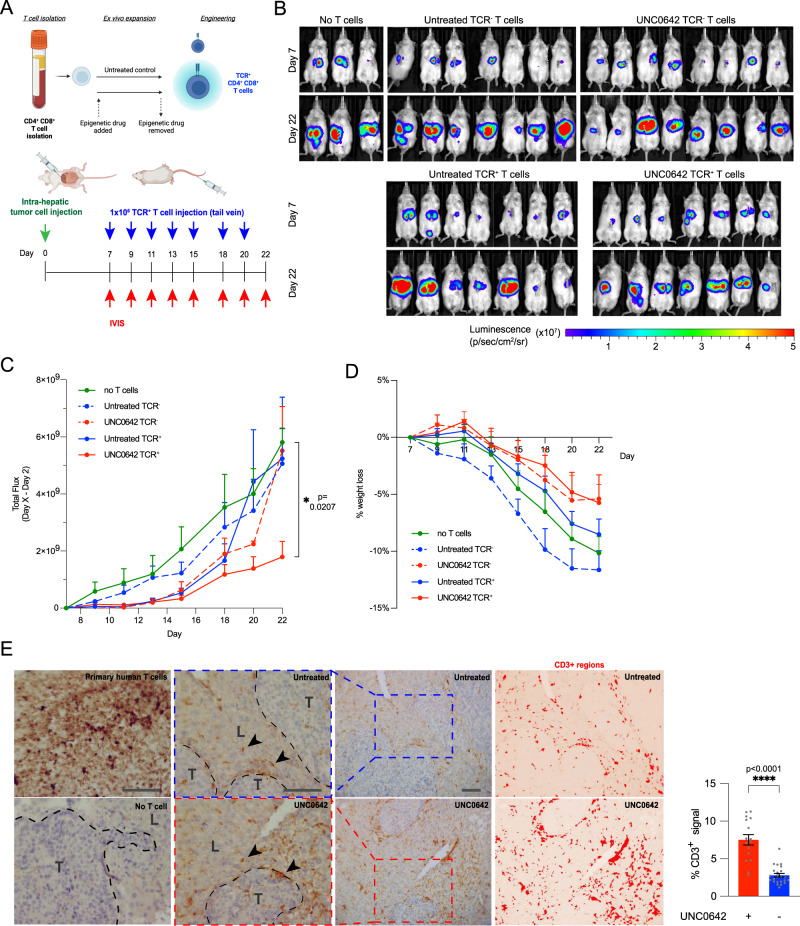
Fig. 5. UNC0642 treatment improves the ani-tumor activity in vivo.
A Overall design of in vivo experiment. 2 M HepG2-2.2.15-luc cells were injected intra-hepatically at the start of the experiment. At day 7, mice were allocated into 5 groups and 1 M of untreated or UNC0642-treated TCR+ or TCR- T cells were injected intra-venously. Tumor volume was monitors by IVIS imaging and T cell injections were repeated every 2 days until day 21 post-tumor injection. Created with BioRender.com. B Images taken using the in vivo bioluminescence imaging system at day 7 and at day 21 post-tumor injection. All mice analyzed are shown. C Tumor volume was tracked using bioluminescence and shown as total photon flux (p/s) relative to day 7 post-tumor injection over time. Data at day 21 are analyzed with one-way ANOVA with multiple comparisons. N = 3 for no T cell control mice; 8 for UNC0642-treated TCR- T cell mice; 7 for all other conditions. D Percentage loss of body weight. Data are analyzed with one-way ANOVA with multiple comparisons, N > 3 mice per condition, as shown in B. E Immunohistochemical images of liver sections stained for CD3 to identify T cells, with normal liver (L) and tumor (T) areas indicated and arrowheads point to T cells. Automatically segmented images of CD3 + regions in liver sections stained for CD3. Primary human T cells serve as positive staining control and no T cell sample as negative staining control. Scale bar represents 50um. Quantification of CD3+ regions in automatically segmented liver sections from tumors treated with untreated and UNC0642-treated TCR+ T cells. Data are analyzed with two-sided Mann–Whitney test, N > 4 biologically independent mice, 4 analyzed sections per mouse. All data are shown as mean ± SEM. *P < 0.05, **P < 0.01, ***P < 0.001, ****P < 0.0001. Source data are provided as a Source Data file.

