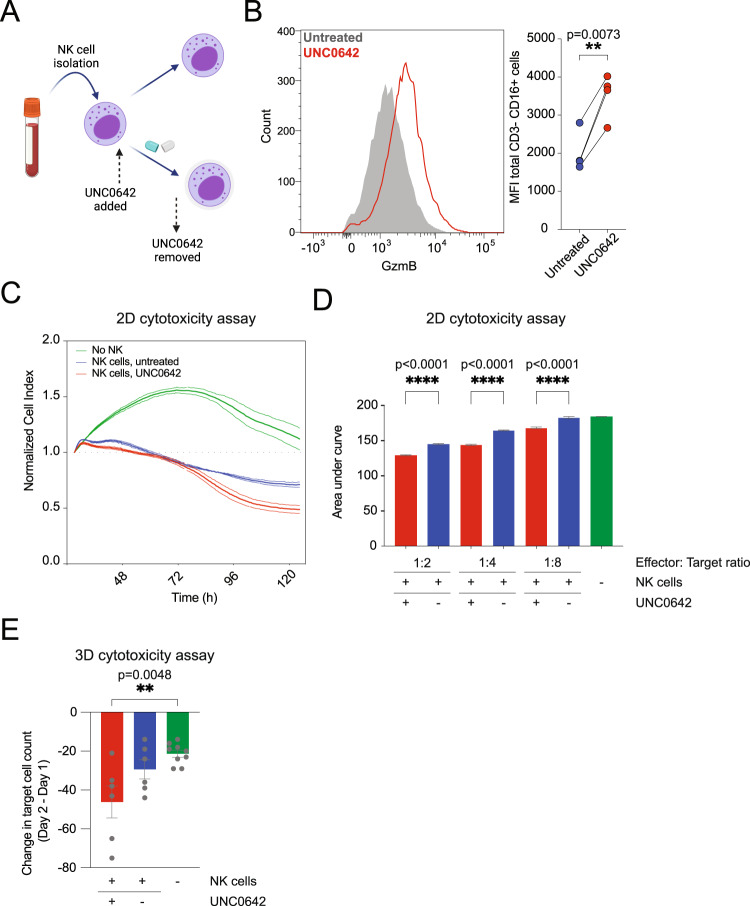
Fig. 8. UNC0642 increases NK cell cytotoxicity.
A Workflow for NK isolation and UNC0642 treatment during NK cell expansion. Created with BioRender.com. B Granzyme B expression levels in NK cells after UNC0642 treatment (n = 3 donors). C Example normalized cell index for 2D cytotoxicity assay for untreated and UNC0642-treated NK cells. D Area under the curve for the normalized cell index for the 2D cytotoxicity assay as shown in example plot in C. Data for untreated and UNC0642-treated NK cells at 1:2, 1:4 and 1:8 effector:target ratio are shown. Data are analyzed with one-way ANOVA with multiple comparisons. (n = 3 donors). E Normalized live target cell count for the 3D cytotoxicity assay for target cells after addition of untreated or UNC0642-treated NK cells (n = 3 donors, each data point represents an analyzed ROI). Data are analyzed with one-way ANOVA with multiple comparisons. Data shown are for four different donors. All data are shown as mean ± SEM. *P < 0.05, **P < 0.01, ***P < 0.001, ****P < 0.0001. Source data are provided as a Source Data file.

