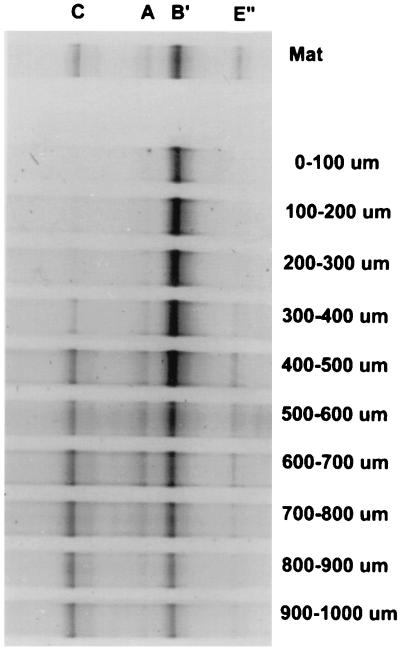
FIG. 7.
Distribution of 16S rRNA gene segments of populations detected by DGGE through the upper 1-mm vertical interval of the 61°C Mushroom Spring cyanobacterial mat. Each lane represents DGGE analysis of a separate 100-μm-thick cryotome section. Bands are labeled as described in the legend to Fig. 5 (111).

