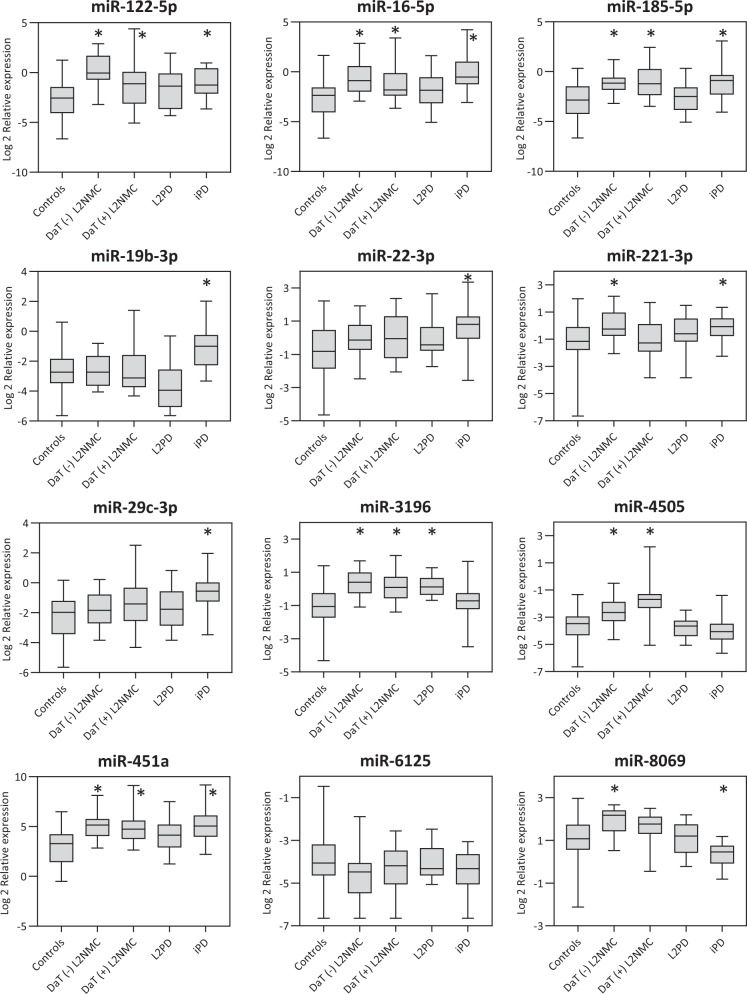
Fig. 3. Relative serum miRNA expression levels in DaT-negative L2NMC, DaT-positive L2NMC, L2PD, iPD and controls as assessed by RT-qPCR.
The central line of the boxes is plotted at the median, the boxes extend from the 25th to the 75th percentiles, and the whiskers extend to the minimum and maximum value. (*) depicts statistically significant DEmiR with fold-change difference above |1.5| and a multiple-test adjusted p value below 0.05 under two-tailed Student’s t test. DaT DaT-SPECT imaging, L2NMC LRRK2 non-manifesting carriers, L2PD LRRK2-associated PD patients, iPD idiopathic PD patients.

