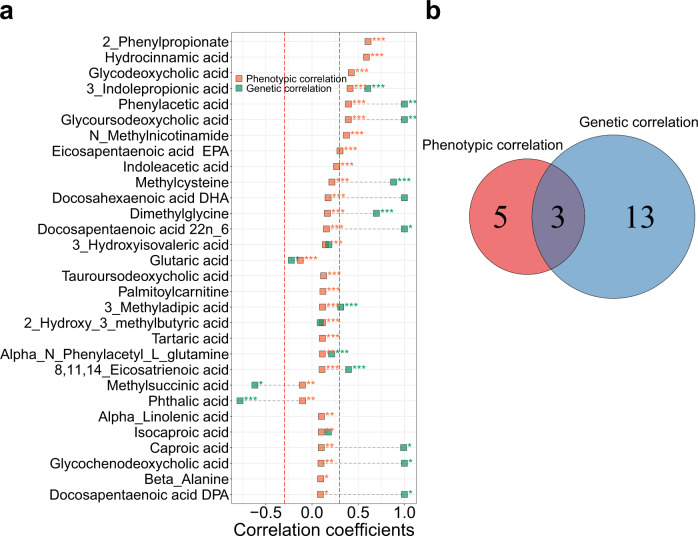
Fig. 2. Phenotypic and genetic correlations between paired fecal and blood metabolites.
a Phenotypic and genetic correlations between paired fecal and blood metabolites for the top 30 metabolites that are ranked by phenotypic correlations. Phenotypic correlations between paired fecal and blood metabolites are estimated by partial Spearman correlation analysis, adjusted by age, sex and BMI. Genetic correlations are calculated using bivariate GREML analysis. Correlations with FDR < 0.05 and > 0.3 (red dashed lines) are considered significant. FDR is controlled by the Benjamini-Hochberg method. *FDR < 0.05, **FDR < 0.01, *** FDR < 0.005. The results for remaining metabolites are shown in Supplementary Fig. 2. For genetic correlation analysis, there are 38 metabolites that do not converged during the calculation process and thus have no results. b The overlap between significant phenotypic and genetic correlations. All statistical tests are two-sided. Source data are provided as a Source Data file.

