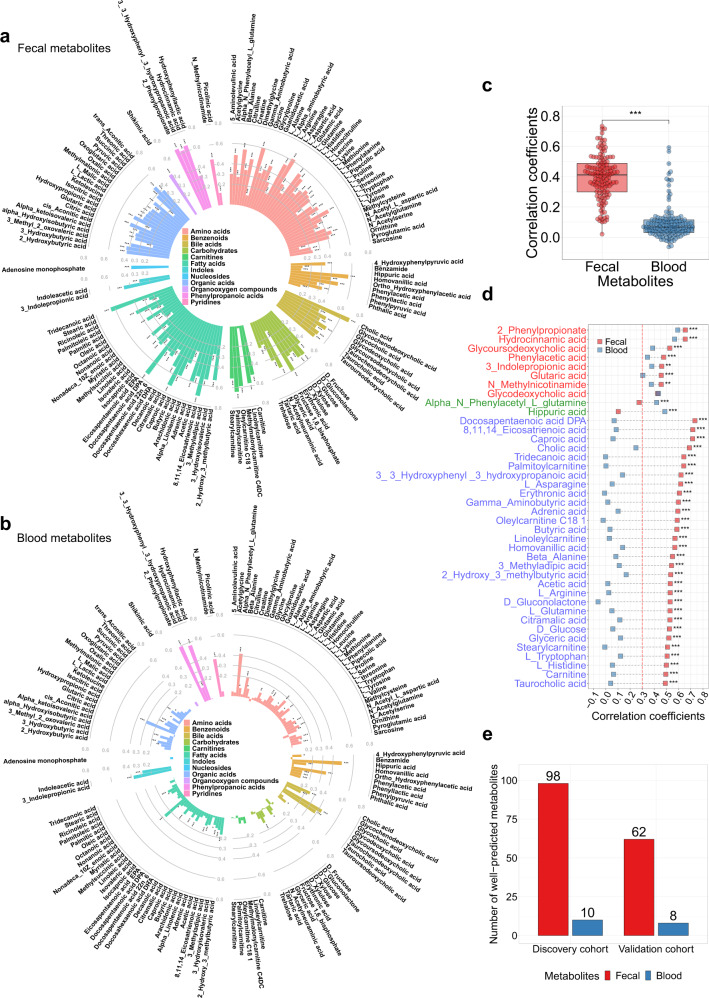
Fig. 3. Comparisons between paired fecal and blood metabolites in their associations with taxonomic composition.
a The associations of taxonomic composition with fecal metabolites, and b with blood metabolites. The random forest model with five-fold cross-validation is used to predict the fecal or blood metabolite levels based on taxonomic composition. Spearman’s correlation between measured and predicted metabolite levels is used to measure the association of taxonomic composition with fecal or blood metabolites. *FDR < 0.05, **FDR < 0.01, *** FDR < 0.005. c The distributions of the associations of taxonomic composition with fecal and blood metabolites (n = 132). The difference between the distributions of taxonomic composition-fecal metabolite associations and taxonomic composition-blood metabolite associations is tested by Wilcoxon signed-rank test. Box plots indicate median and interquartile range (IQR). The upper and lower whiskers indicate 1.5 times the IQR from above the upper quartile and below the lower quartile. ***P < 0.0001. d Differences between the associations of taxonomic composition with paired fecal and blood metabolites that are well-predicted in both feces and blood (marked with red in y axis), metabolites that are only well-predicted in blood and not in feces (marked with green in y axis), and the top 30 metabolites that are only well-predicted in feces and not in blood (marked with blue in y axis). Metabolites are ranked by the predictability of fecal metabolites. Differences between the associations of taxonomic composition/microbial pathways with paired fecal and blood metabolites are tested by the method proposed by Hittner et al. (see ”Methods”). *FDR < 0.05, **FDR < 0.01, ***FDR < 0.005. The results for the top 31–90 metabolites that are only well-predicted in feces and not in blood are presented in Supplementary Fig. 7a. e The number of well-predicted fecal and blood metabolites based on taxonomic composition and the number of validated associations between taxonomic composition and well-predicted fecal/blood metabolites in the validation cohort. Well-predicted metabolites are defined as Spearman’s correlation coefficient > 0.3 and FDR < 0.05. FDR is controlled by the Benjamini–Hochberg method. Associations with Spearman’s correlation coefficient > 0.3 and FDR < 0.05 are considered as being validated in the validation cohort. All statistical tests are two-sided. Source data are provided as a Source Data file.

