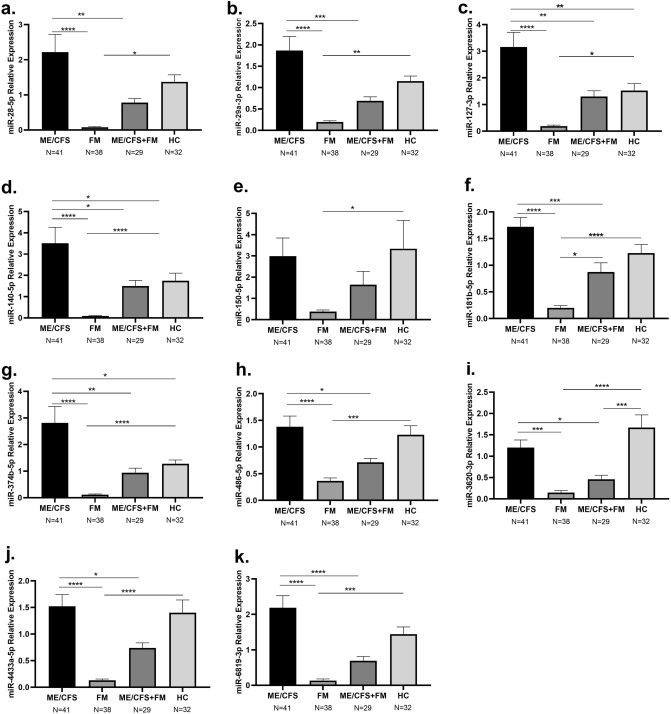
Figure 2.
Relative expression of circulating miRNAs in individuals with ME/CFS, FM, ME/CFS + FM and HC. Displayed in the graphs are the mean and ± standard error of the mean of (a) hsa-miR-28-5p (b) hsa-miR-29a-3p (c) hsa-miR-127-3p (d) hsa-miR-140-5p (e) hsa-miR-150-5p (f) hsa-miR-181b-5p (g) hsa-miR-374b-5p (h) hsa-miR-486-5p (i) hsa-miR-3620-3p (j) hsa-miR-4433a-5p (k) hsa-miR-6819-3p. One-way ANOVA followed by Tukey’s multiple comparisons test were performed to determine the significant difference in the miRNA expression between the groups. Results were considered significant at *P value < 0.05, **P value < 0.01, ***P value < 0.001, ****P value < 0.0001.

