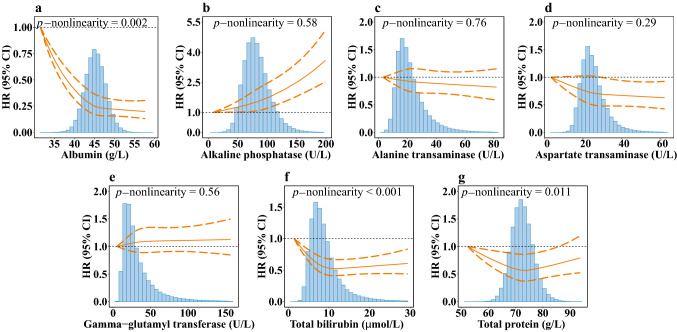
Fig. 1.
Nonlinear associations between serum liver function biomarkers and risk of IBD. a albumin; b alkaline phosphatase; c alanine transaminase; d aspartate transaminase; e gamma-glutamyl transferase; f total bilirubin; g total protein. The reference levels were set as the lowest values of each exposure, respectively. The vertical axis represents the risk of IBD based on the fully adjusted model. The solid line in orange represents hazard ratios, and dashed lines in orange represent 95% confidence intervals. Density plots of each biomarker were presented in gray. CI confidence interval; HR hazard ratio; IBD inflammatory bowel disease

