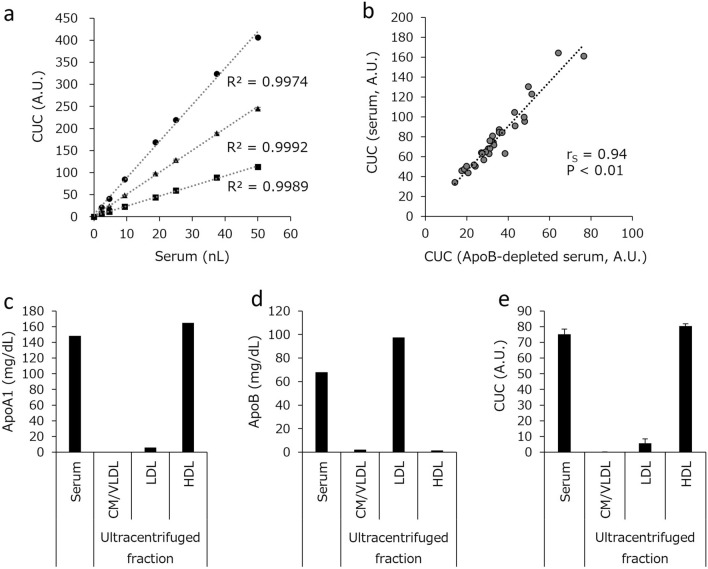
Figure 1.
Dilution linearity of CUC and specificity of the automated CUC assays. (a) Serial dilutions of pooled serum samples with high (circle), middle (triangle), and low (square) CUC were analyzed. (b) CUC of serum and of the corresponding ApoB-depleted serum was measured, and Spearman’s rank correlation coefficient (rS) between them was assessed. HDL and other lipoprotein fractions (CM/VLDL, LDL) were extracted from the pooled sera and ApoA1 (c), ApoB (d), and CUC (e) were measured in each fraction. The values in (a) and (e) represent the mean of triplicate determinations; error bars indicate SD. The values in (b–d) represent the average of duplicate determinations (CUC) or single determinations (ApoA1 and ApoB). A.U. arbitrary units.

