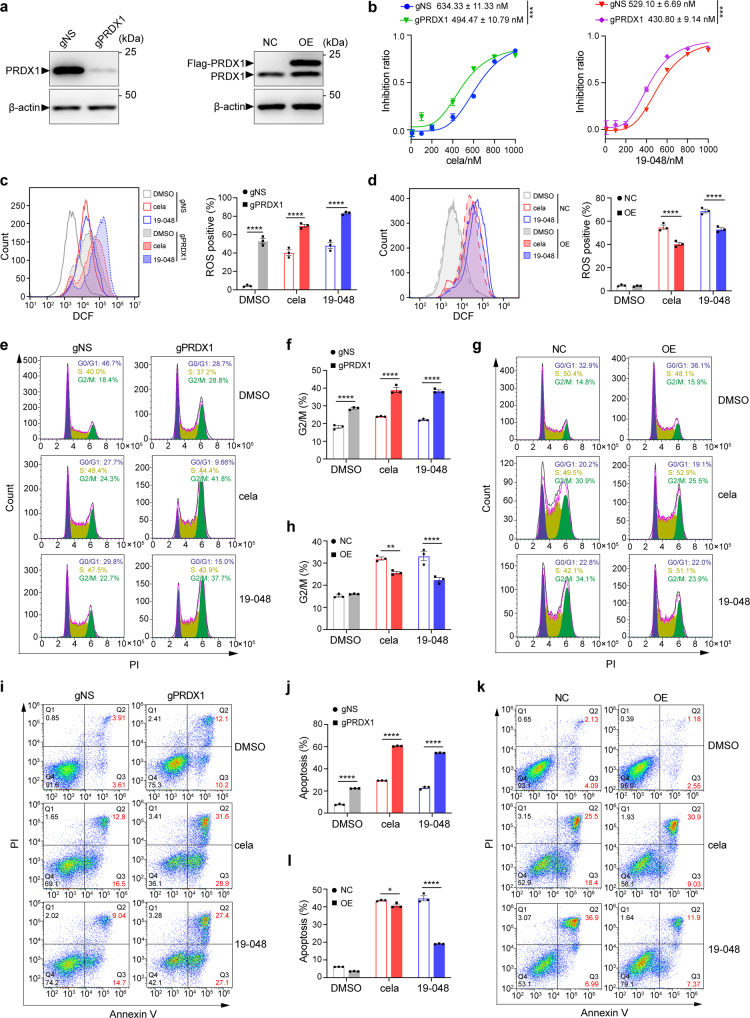
Fig. 5.
Celastrol and compound 19-048 suppressed the proliferation of colorectal cancer cells via targeting PRDX1. a PRDX1 protein level with gPRDX1 (left) or PRDX1 overexpression (right) lentivirus plasmid infection in SW620 cells was analyzed by western blot. Protein names are marked with triangle in the left of corresponding band. Endogenous PRDX1 is marked as “PRDX1”. PRDX1 overexpression fused with an N-terminal flag tag is marked as “Flag-PRDX1”. β-actin was used as internal control. Molecular weights are marked in the right of protein bands. b The IC50 curves of Celastrol or compound 19-048 against the proliferation of scrambled (gNS) and PRDX1 knockdown (gPRDX1) SW620 cells. Compounds were incubated with cells for 24 h before measurement. ***p < 0.001 by Student’s t test. c Intracellular ROS level was analyzed by flow cytometry with DCFH-DA staining in gNS and gPRDX1 SW620 cells with 0.5 μM Celastrol or compound 19-048 for 24 h. Quantification of ROS level in each group and statistical analysis was shown in the right histogram. d Intracellular ROS level was analyzed by flow cytometry with DCFH-DA staining in non-coding control plasmid (NC) and PRDX1 overexpression plasmid (OE) SW620 cells treated with 1 μM Celastrol or compound 19-048 for 24 h. Quantification of ROS level in each group and statistical analysis are shown in the right histogram. e, f Cell cycle distribution was detected by flow cytometry with PI staining in gNS and gPRDX1 SW620 cells treated with 0.5 μM Celastrol or compound 19-048 for 24 h. Quantification of cells in the G2/M phase and statistical analysis are shown as (f). g, h Cell cycle distribution was detected by flow cytometry with PI staining in NC and OE SW620 cells treated with 1 μM Celastrol or compound 19-048 for 24 h. Quantification of cells in the G2/M phase and statistical analysis are shown as (h). i, j Apoptotic cells were measured by flow cytometry with Annexin V and PI staining in gNS and gPRDX1 SW620 cells treated with 0.5 μM Celastrol or compound 19-048 for 24 h. Quantification of apoptotic cells (Annexin V+) and statistical analysis are shown as (j). k, l Apoptotic cells were measured by flow cytometry with Annexin V and PI staining in NC and OE SW620 cells treated with 1 μM Celastrol or compound 19-048 for 24 h. Quantification of apoptotic cells (Annexin V+) and statistical analysis is shown as (l). Data are presented as mean ± SEM (n = 3). Statistical significance was determined by two-way ANOVA. *p < 0.05, **p < 0.01, ***p < 0.001, ****p < 0.0001

