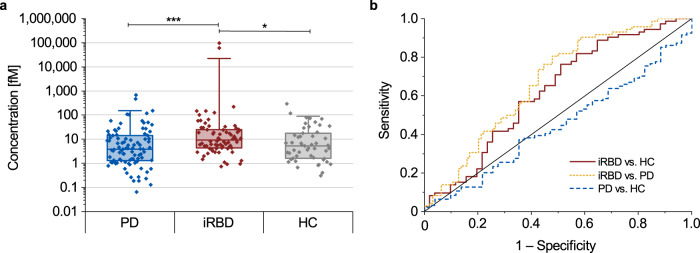
Fig. 6. Calibrated sFIDA results and receiver operating characteristic (ROC) analyses for detecting α-synuclein aggregates in stool samples.
Median concentrations of α-synuclein aggregates in stool samples of iRBD patients (9.2 fM) were significantly elevated compared to those of healthy controls (HC, 5.2 fM, p = 0.024) or PD patients (3.8 fM, p < 0.001). PD patients did not significantly differ from healthy controls. Box plots indicate the lower (Q1) and upper (Q3) quartiles as boxes. Horizontal lines within boxes indicate medians. Whiskers indicate 1.5 times the interquartile range (Q3–Q1) above Q3 and below Q1. Data falling outside this range are plotted as outliers. Significant differences between groups were calculated using the Kruskal–Wallis H test. ***p < 0.001, **0.001 ≤ p < 0.01, *0.01 ≤ p < 0.05. Error bars indicate standard deviation. b In the ROC analyses, discrimination of PD patients versus healthy controls showed a specificity of 96.1% and a sensitivity of 6.4%, with an area under the curve (AUC) of 0.447. In comparison, discrimination of iRBD patients versus healthy controls showed a specificity of 49.0% and a sensitivity of 76.4% with an AUC of 0.622 (see Table 2 for other specificity and sensitivity values and significances).

