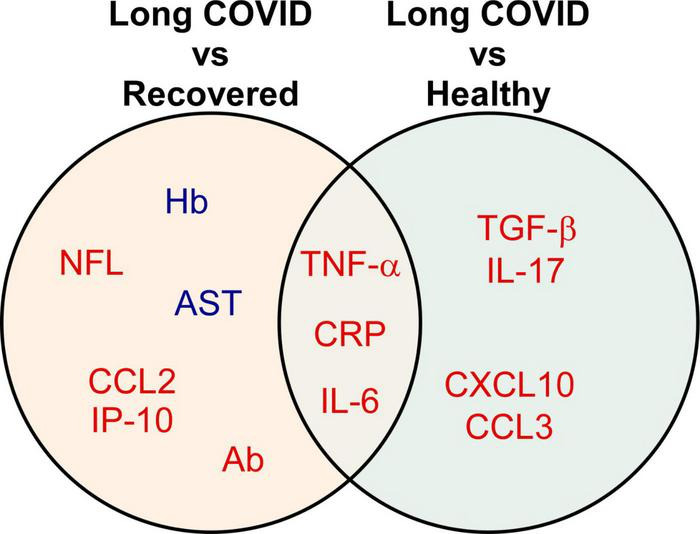
FIGURE 3.

Biomarkers significantly associated with different comparison groups. The Venn diagram presents the 13 biomarkers that were reported by two or more eligible studies. Red indicates up-regulated, while blue refers to down-regulated biomarkers. A detailed list of abbreviations in Figure 3 can be found in Supplementary Table 2.
