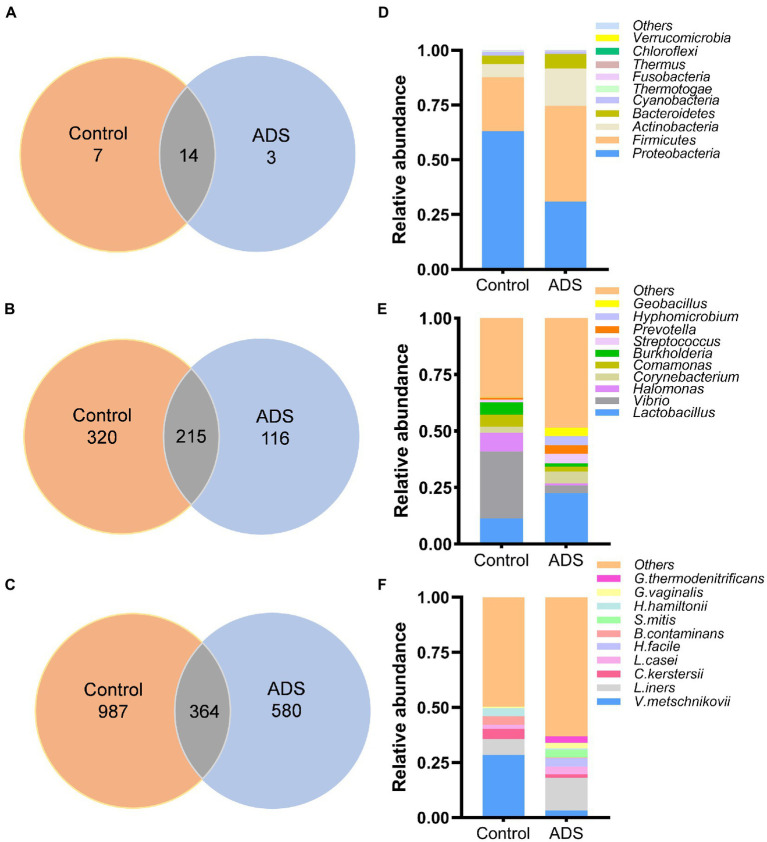
Figure 2.
Disparities in bacterial distribution between the adenomyosis (ADS) group and control group. Venn diagram representing the total number of bacterial at the phylum (A), genus (B), and species (C) levels; Colum chart showing the top 10 taxa of endometrial microbiota between the two groups at the phylum (D), genus (E), and species (F) levels. V. metschnikovii, Vibrio metschnikovii; L. iners, Lactobacillus iners; C. kerstersii, Comamonas kerstersii; B. contaminans, Burkholderia contaminans; H. hamiltonii, Halomonas hamiltonii; L. casei, Lactobacillus casei; G. vaginalis, Gardnerella vaginalis; G. thermodenitrificans, Geobacillus thermodenitrificans; H. facile, Hyphomicrobium facile; S. mitis, Streptococcus mitis.

