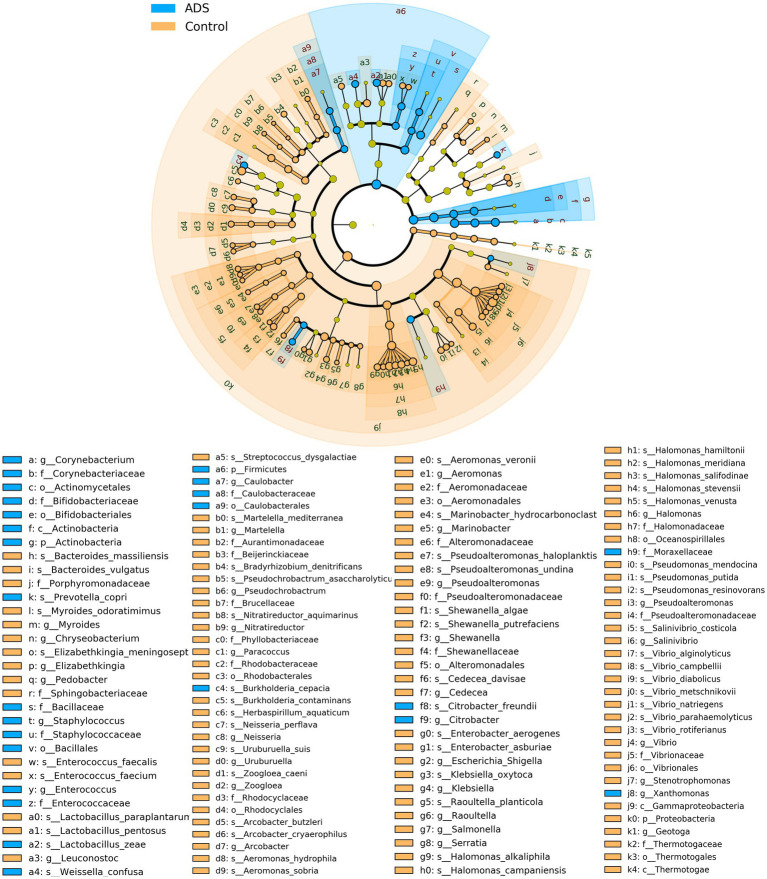
Figure 6.
Cladogram report. The circle radiating from the inside to outside represents the classification level (from phylum to genus or species). Species without significant differences are colored yellow. Biomarkers were shown by specific colors in each group; the blue nodes indicate the bacteria that play an important role in the adenomyosis (ADS) group while the orange nodes indicate the microbial groups that play an important role in the control group. Prefixes represent abbreviations for each taxon: phylum (p_), class (c_), order (o_), family (f_), genus (g_), species(s_). Only statistically significant differences (p < 0.05) are shown.

