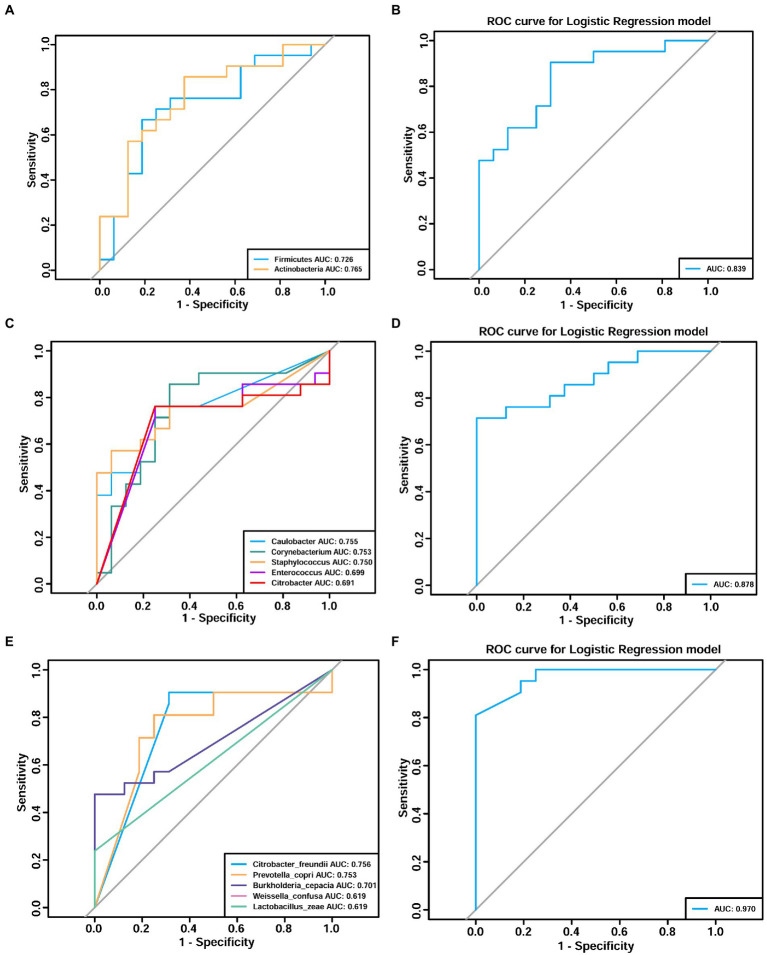
Figure 7.
Receiver operating characteristic (ROC) analyses demonstrating the adenomyosis diagnosis efficacy of the endometrial microbiome at the phylum (A,B), genus (C,D), and species (E,F) levels. Different colors correspond to different taxa. Area under the curve (AUC) analysis was used to quantify the accuracy of adenomyosis diagnosis (an AUC value >0.7 was acceptable).

